Stock Analysis · Alliant Energy Corp (LNT)
Overview
Alliant Energy is a regulated electric and natural gas utility serving customers mainly in Iowa and Wisconsin through two core subsidiaries: Interstate Power and Light and Wisconsin Power and Light. In simple terms, it generates or buys electricity, delivers it through power lines, distributes natural gas through pipelines, and earns most of its money under state-approved rate structures. That makes the business more stable than many industries because demand for power and heating is essential, although returns are also limited and closely overseen by regulators.
The company’s revenue is concentrated in utility operations, with electricity clearly dominating the mix. Based on recent annual reporting, the main sources of revenue can be summarized approximately as follows:
- Electric utility revenue: about 85% to 90% — sales of electricity to residential, commercial, and industrial customers, plus transmission-related activity.
- Gas utility revenue: about 10% to 15% — natural gas distribution to homes, businesses, and other end users.
- Other utility and non-utility activity: less than 5% — smaller items such as other operating revenue and limited non-core activity.
Geographically, the business is also concentrated. Iowa contributes the larger share through Interstate Power and Light, while Wisconsin Power and Light adds the rest. That narrow footprint lowers complexity, but it also means growth depends heavily on constructive regulation and local economic trends rather than broad national expansion.
Over the last several years, revenue has moved within a relatively tight band, while operating income and net income have been steadier than total sales. That pattern is typical for a regulated utility: earnings are often driven less by raw sales volume and more by approved rates, cost recovery, and capital investment added to the regulated asset base.
The business mix shows a company with fairly resilient profitability. Revenue has fluctuated with fuel costs, weather, and rate timing, but profit has held up comparatively well, suggesting that regulation and cost recovery mechanisms have provided some protection even as financing costs have risen.
Key Figures
| Metric | Value | Sector ⓘ |
|---|---|---|
| Date | Oct 17, 2026 | |
| Context | ||
| Sector | Utilities | |
| Industry | Utilities - Regulated Electric | |
| Market Cap ⓘ | $17.36B | |
| Beta ⓘ | 0.52 | |
Value (Cheapness) | ||
| P/E Ratio ⓘ | 20.99 | 17.28 |
| P/B Ratio ⓘ | 2.34 | 1.51 |
| FCF Yield ⓘ | -1.50% | 0.65% |
| Dividend Yield ⓘ | 3.14% | 3.77% |
| EBIT / EV ⓘ | 4.20% | 5.01% |
| PEG ⓘ | 1.96 | |
Growth (Business expansion) | ||
| Revenue Growth ⓘ | 1.00% | 6.10% |
| RPS Growth (5Y CAGR) ⓘ | 3.69% | 3.87% |
| EPS Growth (5Y CAGR) ⓘ | -15.47% | -11.30% |
| BVPS Growth (5Y CAGR) ⓘ | 4.46% | 4.23% |
| Margin Growth (5Y Trend) ⓘ | 2.80% | 3.57% |
| FCF Growth (5Y CAGR) ⓘ | N/A | -8.84% |
| DPS Growth (5Y CAGR) ⓘ | 5.89% | 4.84% |
Quality (Business durability) | ||
| ROIC (Latest) ⓘ | N/A | 6.53% |
| ROA (Latest) ⓘ | 3.27% | 3.20% |
| ROIC (5Y Median) ⓘ | 7.29% | 5.95% |
| ROA (5Y Median) ⓘ | 3.40% | 2.75% |
| Net Debt / EBIT (Latest) ⓘ | 10.08 | 7.13 |
| Net Debt / EBIT (5Y Median) ⓘ | 8.87 | 7.23 |
| Net Debt / EBITDA (Latest) ⓘ | 5.84 | 4.31 |
| Net Debt / Assets ⓘ | 47.76% | 38.42% |
| EBITDA / Interest ⓘ | 3.73 | 4.58 |
| Operating Margin (Latest) ⓘ | 27.09% | 20.83% |
| Operating Margin (5Y Median) ⓘ | 25.75% | 20.08% |
| Debt to Equity (Latest) ⓘ | 160.95% | 137.69% |
| Profit Margin (Latest) ⓘ | 18.45% | 11.37% |
| Free Cash Flow (Latest) ⓘ | -$260.00M | |
Momentum (Price trend) | ||
| 3Y Return ⓘ | +50.10% | +52.37% |
| 12M Return (excl. last month) ⓘ | +6.39% | +8.84% |
| 6M Return ⓘ | -5.21% | -3.95% |
| Price vs. 200-Day MA ⓘ | -3.08% | -0.79% |
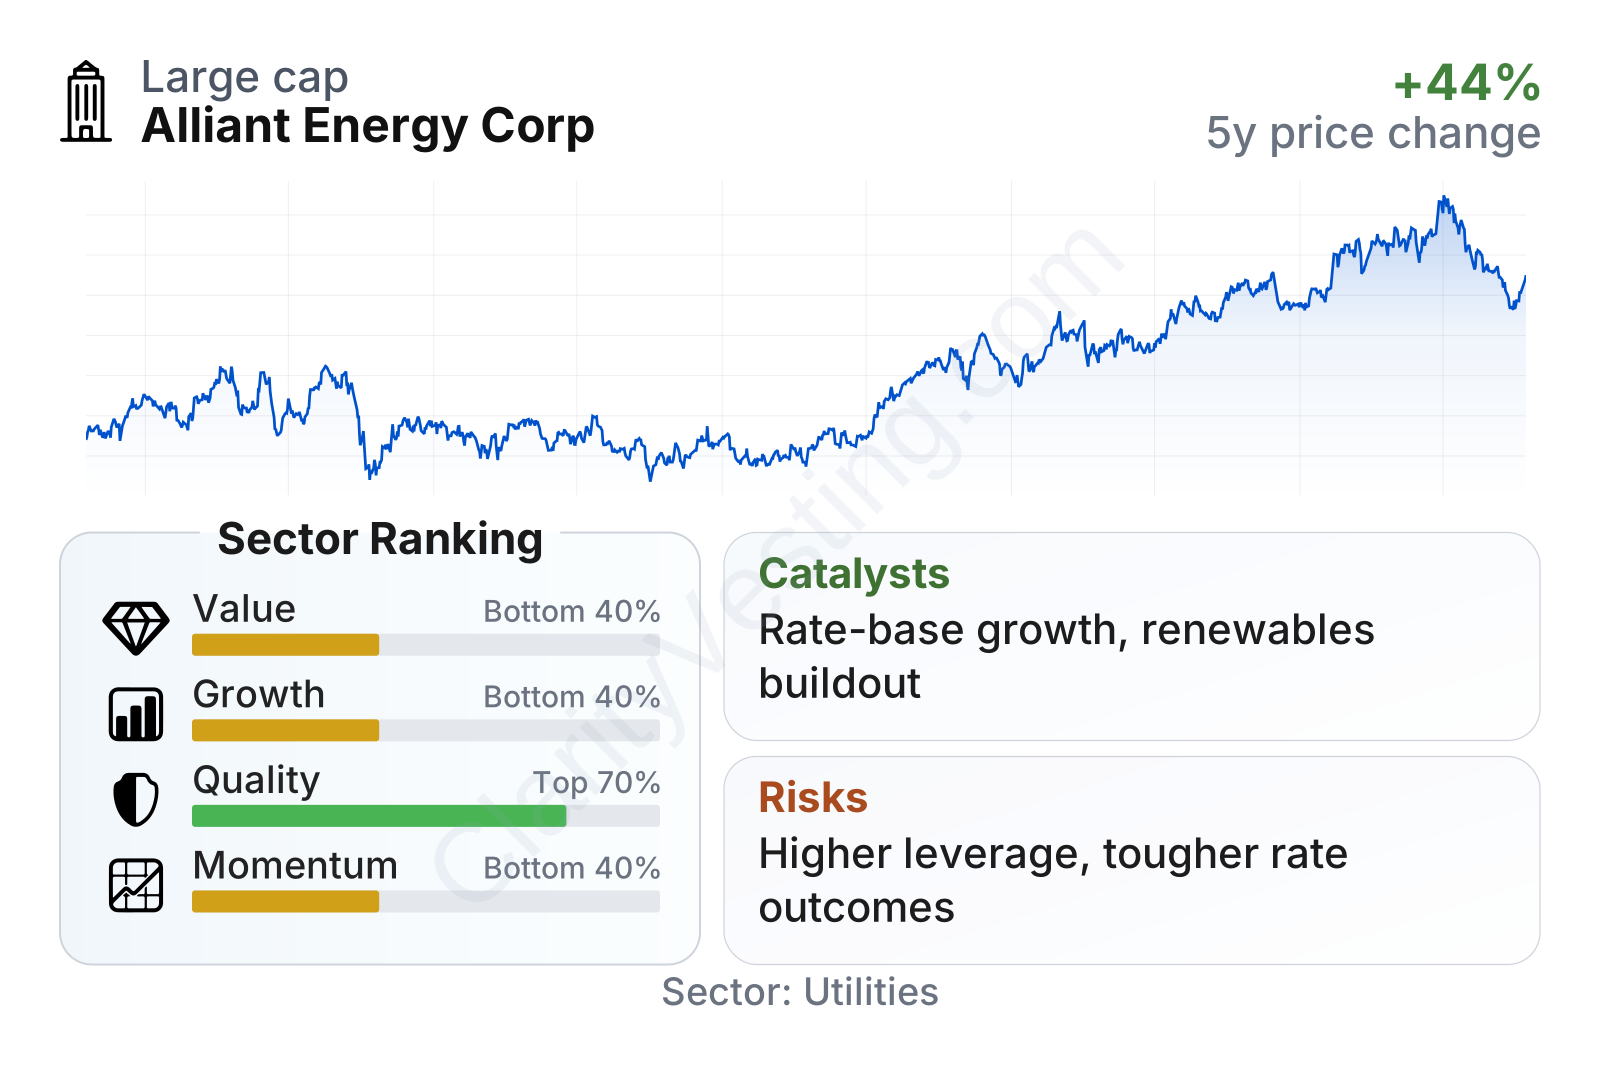
Alliant Energy is a mid-sized utility with relatively low share-price volatility, as shown by its beta of roughly 0.5. In the factor breakdown, quality stands out more positively than value, growth, or momentum. Profitability is better than the sector median, with operating margin around 27% and profit margin near 18%, both comfortably above many regulated peers. On the other hand, valuation is not especially cheap, free cash flow is currently negative, and recent market performance has lagged much of the utility group.
The table also points to a familiar utility profile: stable operations, steady dividends, and modest long-term expansion, but funded with significant borrowing. Debt-related measures are weaker than the sector median, which matters because utilities depend heavily on external capital to build generation, transmission, and distribution infrastructure.
Growth
The utility sector is not a fast-growth industry, but it is in the middle of a large investment cycle. Electricity demand is being supported by grid modernization, renewable generation buildout, transmission upgrades, transportation electrification, and, in some regions, data center development. For companies like Alliant Energy, growth usually comes from increasing the regulated asset base rather than from aggressive customer expansion. When the company invests in approved infrastructure, it can typically earn a regulated return on that capital over time.
Alliant Energy’s strategy fits that model. The company has continued investing in cleaner generation, retiring older coal exposure over time, expanding renewable capacity, and strengthening its grid. This is important because utilities that can replace aging assets with regulated new projects often create a clearer earnings path than those relying mainly on flat legacy systems.
Revenue per share has trended upward over the last five years, though not in a straight line. That supports the view of a company with gradual expansion rather than rapid acceleration. The pace is slightly below the broader sector median, which suggests Alliant is participating in utility growth themes, but not leading the group on top-line momentum.
Free cash flow has been deeply negative, especially more recently, but for a regulated utility that is not automatically a sign of operational weakness. It often reflects heavy capital spending on long-lived projects. The key question is whether those projects are prudent, recoverable in rates, and capable of supporting future earnings. In Alliant’s case, that appears to be the central growth mechanism.
Recent company communications have continued to emphasize capital investment, renewable additions, and system reliability upgrades. Those programs can act as catalysts if regulators remain supportive and project execution stays on schedule. In a utility context, the strongest opportunity is usually not a sudden breakthrough, but a multi-year runway of approved spending that gradually lifts earnings and dividends.
Risks
This article is for informational purposes only and does not constitute financial advice. Some content is AI-generated. See Disclaimer


