Stock Analysis · LondonMetric Property Plc (LNSPF)
Overview
LondonMetric Property Plc is a U.K. real estate investment trust, or REIT, focused mainly on large-scale logistics warehouses, urban distribution assets, and selected long-income properties leased to strong tenants. In simple terms, it owns buildings used to store, move, and sell goods, plus some properties that provide steady rent under long leases. The company has increasingly shaped its portfolio around sectors tied to e-commerce, grocery supply chains, parcel delivery, and essential retail operations.
Its business model is straightforward: buy or develop properties, lease them to tenants, collect rent, and recycle capital by selling assets when management believes values are attractive. As a REIT, it is designed to turn rental income and property value creation into shareholder returns over time.
The main revenue drivers are rental income and property-related gains, although the second item can move sharply from year to year because real estate values change with interest rates and market conditions. Based on recent annual reporting and the latest income mix visible over the past year, the company’s economic inflows can be summarized as follows:
- Rental income from logistics and distribution properties: approximately 60% to 70% of recurring property income. This includes big-box warehouses, last-mile distribution sites, and facilities used by retailers, grocers, and delivery operators.
- Rental income from long-income and convenience-led retail assets: approximately 20% to 30% of recurring property income. These assets are typically leased for long periods and often serve everyday consumer needs.
- Development profits, asset management activity, and other property income: generally a smaller contribution, often below 10% in a normal year, but variable.
- Fair-value movements and gains on disposals: highly variable and not a dependable operating revenue stream. These can strongly lift or reduce reported profit depending on property market conditions.
That mix matters because it shows LondonMetric is not a general landlord spread across every part of commercial real estate. It is concentrated in property types that benefit from modern supply chains and defensive consumer spending, while trying to limit exposure to weaker office markets and more discretionary retail categories.
The latest operating flow also points to a business with very high gross profitability, which is common for property owners, but with earnings that can still be influenced by financing costs and valuation movements. Revenue has expanded meaningfully over the last few years, reflecting acquisitions and portfolio repositioning, while interest expense has also climbed as debt costs reset higher.
Key Figures
| Metric | Value | Sector ⓘ |
|---|---|---|
| Date | Oct 17, 2026 | |
| Context | ||
| Sector | Real Estate | |
| Industry | REIT - Industrial | |
| Market Cap ⓘ | $5.61B | |
| Beta ⓘ | 1.00 | |
Value (Cheapness) | ||
| P/E Ratio ⓘ | 13.53 | 17.38 |
| P/B Ratio ⓘ | 1.15 | 0.85 |
| FCF Yield ⓘ | 9.87% | 7.38% |
| Dividend Yield ⓘ | 5.39% | 4.85% |
| EBIT / EV ⓘ | N/A | 3.78% |
| PEG ⓘ | 3.09 | |
Growth (Business expansion) | ||
| Revenue Growth ⓘ | 18.00% | 5.30% |
| RPS Growth (5Y CAGR) ⓘ | 2.12% | 6.02% |
| EPS Growth (5Y CAGR) ⓘ | -7.46% | -11.37% |
| BVPS Growth (5Y CAGR) ⓘ | -13.03% | 0.45% |
| Margin Growth (5Y Trend) ⓘ | 12.08% | -0.22% |
| FCF Growth (5Y CAGR) ⓘ | 36.37% | 5.40% |
| DPS Growth (5Y CAGR) ⓘ | -0.33% | 5.02% |
Quality (Business durability) | ||
| ROIC (Latest) ⓘ | N/A | 5.69% |
| ROE (Latest) ⓘ | 14.75% | 7.56% |
| ROA (Latest) ⓘ | 8.71% | 2.85% |
| ROIC (5Y Median) ⓘ | 5.20% | 4.22% |
| ROE (5Y Median) ⓘ | 6.76% | 6.03% |
| ROA (5Y Median) ⓘ | 4.01% | 2.44% |
| Net Debt / EBIT (Latest) ⓘ | N/A | 7.59 |
| Net Debt / EBIT (5Y Median) ⓘ | 7.25 | 8.40 |
| Net Debt / EBITDA (Latest) ⓘ | 3.44 | 5.27 |
| Net Debt / Assets ⓘ | 34.94% | 37.76% |
| EBITDA / Interest ⓘ | N/A | 4.10 |
| Operating Margin (Latest) ⓘ | N/A | 35.29% |
| Operating Margin (5Y Median) ⓘ | 90.45% | 37.31% |
| Debt to Equity (Latest) ⓘ | 63.49% | 88.87% |
| Profit Margin (Latest) ⓘ | 63.01% | 19.61% |
| Free Cash Flow (Latest) ⓘ | $553.43M | |
Momentum (Price trend) | ||
| 3Y Return ⓘ | +30.11% | +30.75% |
| 12M Return (excl. last month) ⓘ | +4.83% | +4.36% |
| 6M Return ⓘ | -9.17% | -2.52% |
| Price vs. 200-Day MA ⓘ | -6.36% | -2.34% |
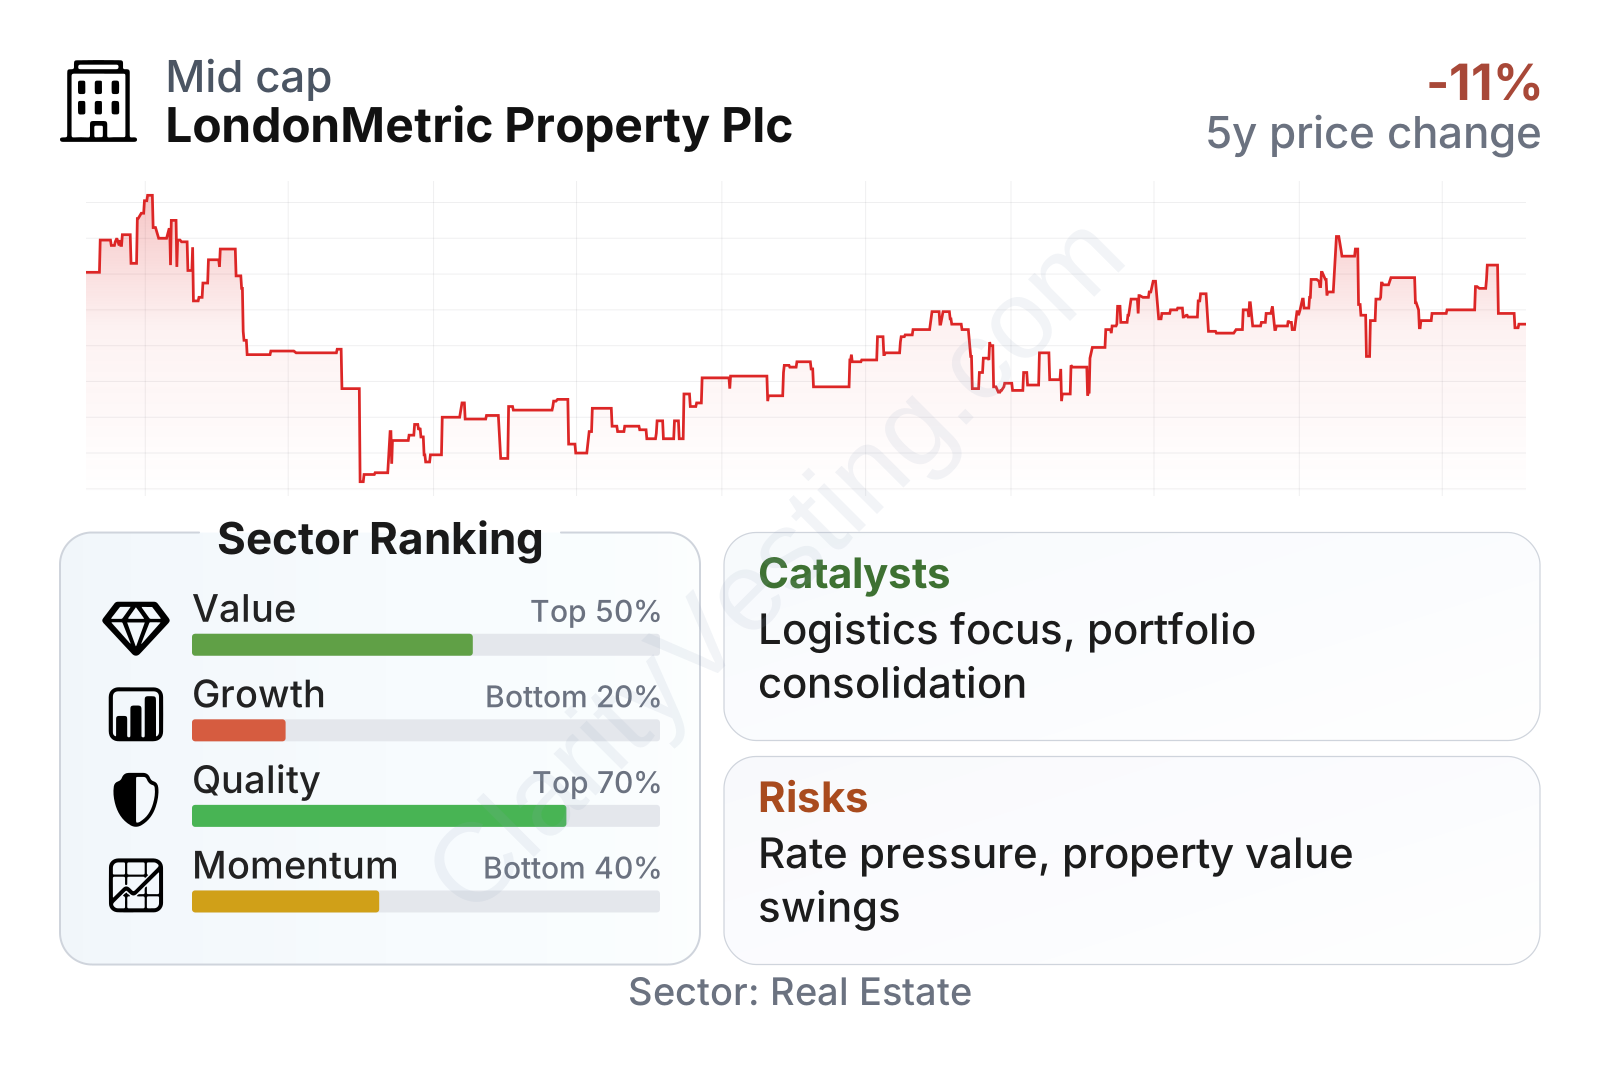
LondonMetric sits in the large-cap range for its niche, with share-price volatility close to the broader market rather than unusually high. On valuation, the stock trades at a lower earnings multiple than the sector median, while its price-to-book ratio is above the sector median. That combination often means the market is assigning some premium to asset quality and portfolio mix, even though it is not pricing the company like a fast-growing platform.
Cash generation looks solid. Free cash flow yield is above the sector median, and the dividend yield is also modestly above the peer median. Profitability measures are strong for the sector, with return on equity near 15% and return on assets near 9%, both comfortably ahead of many real estate peers. Balance-sheet metrics also appear comparatively disciplined: debt-to-equity is around 63%, net debt to EBITDA is about 3.5 times, and net debt relative to assets is just under 35%, all better than typical sector levels.
The weaker area is long-term growth consistency. Recent year-over-year revenue growth has been strong, but five-year revenue-per-share growth has been much slower than the sector median, and dividend growth over five years has been essentially flat to slightly negative. That suggests the company has grown through asset activity and portfolio repositioning, but not always in a smooth straight line on a per-share basis.
Growth
LondonMetric operates in a part of real estate that still has supportive long-term demand. Logistics property remains one of the more attractive segments in commercial real estate because online shopping, faster delivery expectations, inventory resilience, and supermarket distribution all require well-located warehouse space. Even when economic growth slows, supply chains still need modern facilities, and tenants often prefer efficient buildings near major population centers.
The company’s strategy is coherent for that backdrop. Management has spent years moving the portfolio toward logistics and other income streams viewed as more resilient, while recycling capital away from less favored assets. That matters because long-term real estate performance is heavily influenced by location quality, tenant strength, lease structure, and the ability to redeploy capital at the right moments.
Revenue per share shows that growth has been positive over several years but not linear. There was a noticeable lift through 2025 followed by some moderation in 2026. For a property company, that pattern can reflect timing of acquisitions, disposals, developments reaching completion, and changes in the rent roll rather than deterioration in tenant demand alone.
The dividend record looks steady rather than aggressively expanding. Payments have stayed in a relatively narrow range over the past several years. For a REIT, that can be read in two ways: it indicates income continuity, but it also shows that recent growth has not yet translated into a clearly rising distribution trend.
A meaningful catalyst is portfolio concentration in logistics and essential retail-linked real estate at a time when many weaker commercial property categories remain under pressure. Another is the company’s ability to use its balance sheet and market access to acquire assets or portfolios from sellers facing refinancing pressure. In a higher-rate environment, well-capitalized landlords can sometimes improve portfolio quality by buying from more stressed competitors.
Recent corporate developments have also reinforced scale. LondonMetric has continued to pursue large transactions and consolidation in U.K. listed property, which can expand rental income, improve tenant diversification, and create cost efficiencies if integration is executed well. In a fragmented market, scale can matter for debt financing, development opportunities, and deal sourcing.
Risks
This article is for informational purposes only and does not constitute financial advice. Some content is AI-generated. See Disclaimer


