Stock Analysis · Longfor Group Holdings Limited (LNGPF)
Overview
Longfor Group Holdings Limited is a large Chinese real estate company. It began as a home developer, but over time it expanded into shopping malls, rental housing, property management, and other real-estate-related services. That broader model matters because it gives the company more than one way to earn money, even though residential development still remains the core activity.
The business is centered on China, where Longfor develops and sells residential projects, invests in income-producing commercial properties, and operates service platforms tied to homes and communities. In simple terms, one part of the company builds and sells properties, another part owns properties that generate recurring rent, and another part provides services after the buildings are delivered.
Based on the company’s recent reporting structure and historical mix, revenue is mainly driven by the following sources:
- Property development and sales: approximately 75% to 85% of revenue in recent years. This includes the sale of residential units, parking spaces, and related delivered properties.
- Property investment: approximately 8% to 15% of revenue. This mainly comes from rental income from shopping malls, office buildings, and other commercial properties held by the company.
- Property management and related services: approximately 5% to 10% of revenue. This includes community management, value-added services, and operational services linked to residential and commercial projects.
- Other businesses: usually a small share. This can include long-term rental apartment operations and assorted real-estate-related services.
That mix shows the main attraction and the main limitation at the same time. Longfor is not a pure homebuilder anymore, which helps diversify cash generation, but its results are still heavily exposed to the Chinese housing market.
Over the last several years, the company’s total revenue and profit pool have contracted sharply from earlier peaks. Revenue moved down materially from 2022 through 2025, and net income dropped even more steeply. At the same time, financing costs stayed fairly contained and administrative expenses were reduced, which suggests management has been focused on preserving balance-sheet stability rather than chasing aggressive expansion.
The long-term pattern is clear: Longfor remains a sizable operator, but it is working through a much smaller earnings base than it had during the stronger phase of China’s property cycle.
Key Figures
| Metric | Value | Sector ⓘ |
|---|---|---|
| Date | Oct 03, 2026 | |
| Context | ||
| Sector | Real Estate | |
| Industry | Real Estate - Development | |
| Market Cap ⓘ | $5.63B | |
| Beta ⓘ | 2.04 | |
Value (Cheapness) | ||
| P/E Ratio ⓘ | N/A | 17.35 |
| P/B Ratio ⓘ | 0.00 | 0.86 |
| FCF Yield ⓘ | 793.12% | 7.47% |
| Dividend Yield ⓘ | N/A | 4.75% |
| EBIT / EV ⓘ | N/A | 3.81% |
| PEG ⓘ | 0.12 | |
Growth (Business expansion) | ||
| Revenue Growth ⓘ | -32.30% | 5.30% |
| RPS Growth (5Y CAGR) ⓘ | 30.55% | 5.96% |
| EPS Growth (5Y CAGR) ⓘ | -32.08% | -11.41% |
| BVPS Growth (5Y CAGR) ⓘ | 48.42% | 0.41% |
| Margin Growth (5Y Trend) ⓘ | -11.69% | 0.53% |
| FCF Growth (5Y CAGR) ⓘ | -6.00% | 5.40% |
| DPS Growth (5Y CAGR) ⓘ | -15.17% | 5.02% |
Quality (Business durability) | ||
| ROIC (Latest) ⓘ | N/A | 5.77% |
| ROE (Latest) ⓘ | 6.23% | 7.64% |
| ROA (Latest) ⓘ | 1.23% | 2.85% |
| ROIC (5Y Median) ⓘ | 3.94% | 4.20% |
| ROE (5Y Median) ⓘ | 20.45% | 6.03% |
| ROA (5Y Median) ⓘ | 1.73% | 2.45% |
| Net Debt / EBIT (Latest) ⓘ | 6.97 | 7.57 |
| Net Debt / EBIT (5Y Median) ⓘ | 7.75 | 8.41 |
| Net Debt / EBITDA (Latest) ⓘ | 6.76 | 5.12 |
| Net Debt / Assets ⓘ | 23.77% | 37.84% |
| EBITDA / Interest ⓘ | 9.71 | 4.11 |
| Operating Margin (Latest) ⓘ | 8.88% | 35.40% |
| Operating Margin (5Y Median) ⓘ | 15.37% | 36.59% |
| Debt to Equity (Latest) ⓘ | 96.48% | 89.06% |
| Profit Margin (Latest) ⓘ | -0.30% | 19.99% |
| Free Cash Flow (Latest) ⓘ | $44.68B | |
Momentum (Price trend) | ||
| 3Y Return ⓘ | -47.37% | +30.60% |
| 12M Return (excl. last month) ⓘ | -27.08% | +7.55% |
| 6M Return ⓘ | -39.50% | +0.69% |
| Price vs. 200-Day MA ⓘ | -30.42% | -2.30% |
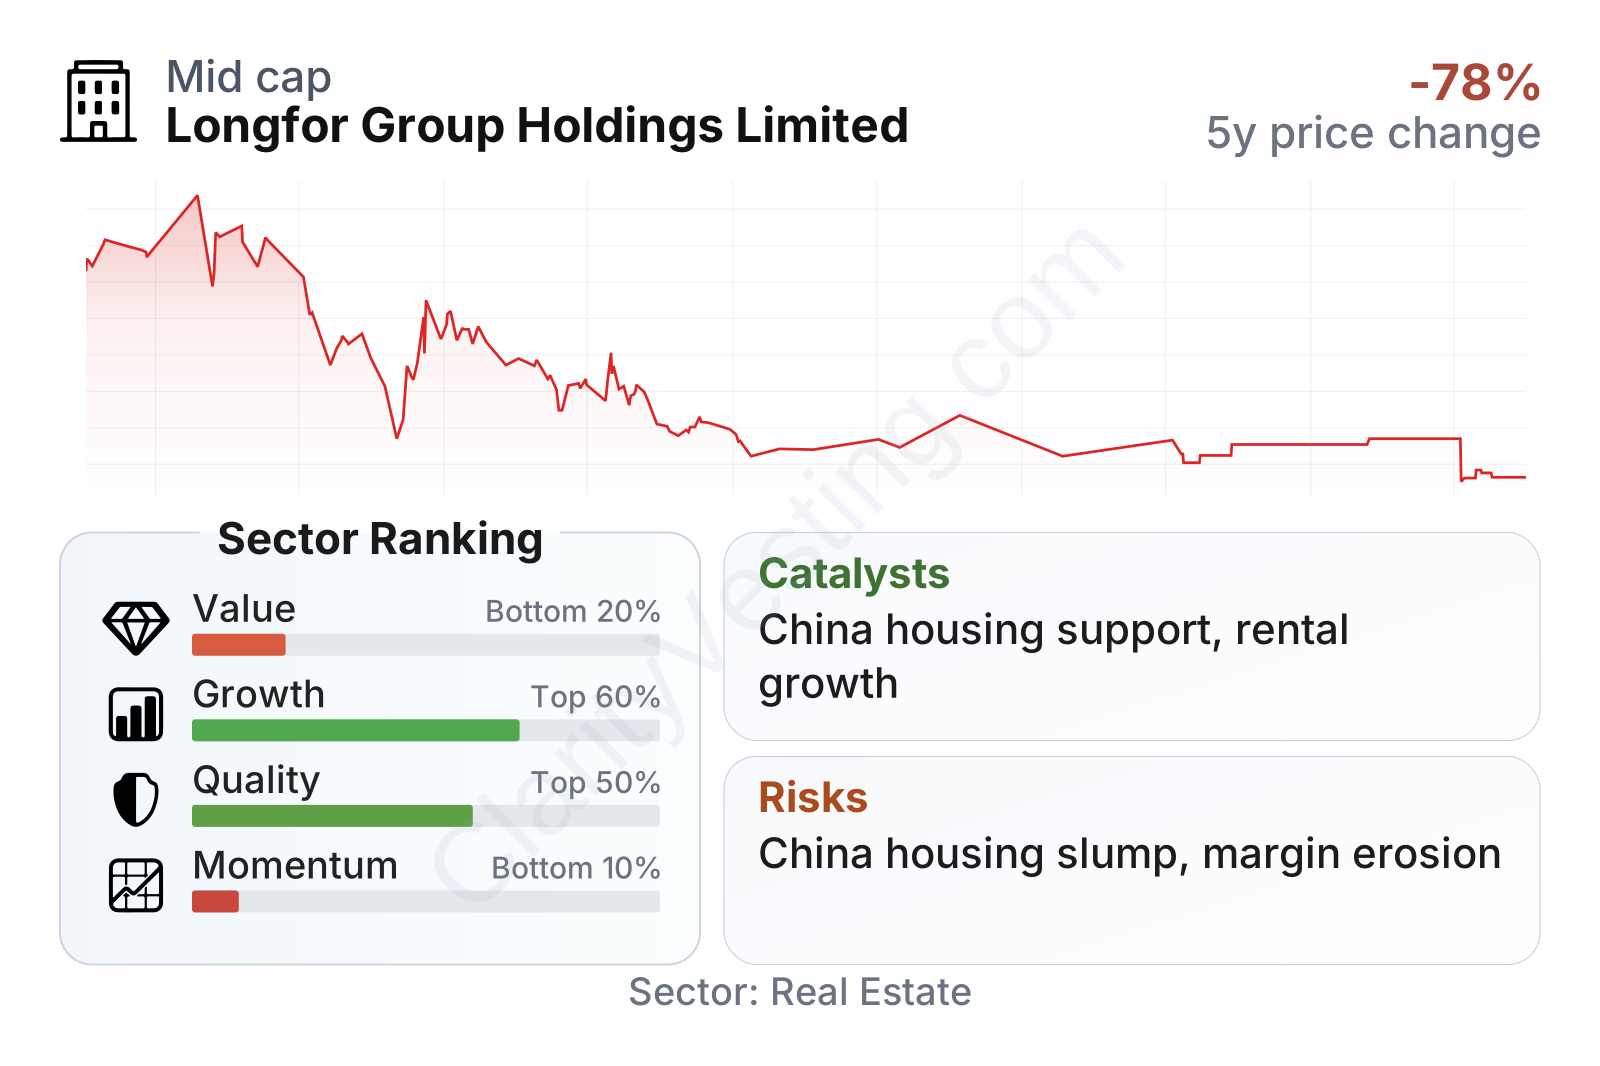
Longfor sits in the mid-to-large range by market value, but its share price has been very volatile, with a beta above 2. The market is clearly treating it as a high-risk real estate name rather than a stable income vehicle.
The metrics table shows a mixed picture. On valuation, the stock screens as very depressed, especially on price-to-book, which is far below the sector median. Free cash flow yield also looks unusually high. But those cheap-looking figures need to be read alongside weak profitability and negative recent growth. Revenue fell about 32% year over year, profit margin slipped slightly below zero, and operating margins are much thinner than the sector median. On the positive side, leverage against total assets is not extreme for the industry, and interest coverage is comfortably above the sector median, which points to a balance sheet that is under pressure but not appearing immediately distressed.
Momentum is the weakest area. The stock has badly underperformed the broader real estate group over the last 6 months, 12 months, and 3 years, and it trades well below its long-term trend line. In practice, that usually means the market is still discounting further bad news or a very slow recovery.
Growth
Longfor operates in a sector that still has long-term economic importance in China, but near-term growth conditions remain difficult. Residential property development is no longer enjoying the easy expansion that defined the previous decade. Demand is weaker, buyer confidence is fragile, and the industry is dealing with excess supply in several areas. That means the sector is still important, but it is not currently a broad-based growth market.
Against that backdrop, Longfor’s strategy makes sense in principle. The company has spent years building recurring-income businesses such as shopping malls, investment properties, and property services. Those activities tend to be steadier than apartment sales and can soften the impact of housing downturns. This is one of the more important reasons Longfor has been viewed as more resilient than many private-sector Chinese developers.
The revenue-per-share trend shows why caution is still necessary. Even if the longer-term record contains periods of strong expansion, the business has recently been moving through a sharp contraction. In other words, the strategic direction is reasonable, but current operating conditions are still working against headline growth.
A meaningful catalyst would be a sustained stabilization in China’s housing market, especially in higher-quality cities where Longfor has traditionally had stronger exposure. Additional policy support for home purchases, lower mortgage costs, or improved access to refinancing for developers could all help transaction volumes and project completions. Another useful catalyst would be continued growth in rental and commercial operations, because that would gradually reduce the company’s dependence on one-off property sales.
The dividend record also reflects the pressure of the last few years. Payouts were reduced sharply from earlier levels, and while there was some rebound more recently, the pattern does not yet point to a stable income profile. For long-term analysis, that matters less as a source of return and more as a signal that management is prioritizing liquidity and flexibility.
There has also been a broader industry push in China toward completing pre-sold housing projects, lowering inventory pressure, and supporting more financially solid developers. In that context, Longfor’s relatively better financing profile compared with more distressed peers could become an advantage if market conditions improve.
Risks
This article is for informational purposes only and does not constitute financial advice. Some content is AI-generated. See Disclaimer


