Stock Analysis · Lumexa Imaging Holdings Inc (LMRI)
Overview
Lumexa Imaging Holdings Inc operates in medical devices, with a focus on imaging-related products and services used by healthcare providers. In simple terms, the company makes money by supplying equipment and related support that help hospitals and clinics capture, manage, or use medical images in patient care. Based on its scale and industry classification, it appears to sit in the middle range of the healthcare equipment market rather than among the very largest global device groups.
Publicly available company materials indicate that revenue is primarily tied to product sales, with additional contributions from recurring activities such as service, maintenance, and other support offerings. Detailed current-year segment percentages were not available in the materials reviewed, so the revenue mix cannot be broken down with precision. What can be observed from recent annual financials is that the business remains heavily product-driven, while service-related activity likely supports customer retention and equipment uptime.
- Imaging equipment and device sales: the main source of revenue, tied to hardware placed with healthcare customers.
- Service and maintenance: ongoing support contracts, repairs, and technical servicing linked to installed systems.
- Other related revenue: may include accessories, replacement components, software-related support, or smaller ancillary activities depending on the company’s reporting structure.
The recent income profile shows a business with a little more than $1.0 billion in annual revenue, but still under pressure from high production costs and financing expenses. Revenue increased from about $936 million in 2023 to about $1.02 billion in 2025, while operating income improved much faster. That suggests the underlying business became more efficient, even though bottom-line profit remained negative because interest expense continued to absorb a large share of earnings.
The multi-year cost and profit flow points to a useful pattern for long-term analysis: sales have grown steadily, operating income has improved sharply, and net losses have narrowed. The weak point is not demand alone, but the combination of modest gross margins and a heavy interest burden.
Key Figures
| Metric | Value | Sector ⓘ |
|---|---|---|
| Date | Oct 17, 2026 | |
| Context | ||
| Sector | Healthcare | |
| Industry | Medical Devices | |
| Market Cap ⓘ | $1.01B | |
| Beta ⓘ | N/A | |
Value (Cheapness) | ||
| P/E Ratio ⓘ | N/A | 24.79 |
| P/B Ratio ⓘ | 1.68 | 3.08 |
| FCF Yield ⓘ | 3.14% | 3.15% |
| Dividend Yield ⓘ | N/A | 1.94% |
| EBIT / EV ⓘ | 3.03% | 0.57% |
| PEG ⓘ | N/A | |
Growth (Business expansion) | ||
| Revenue Growth ⓘ | 5.10% | 7.45% |
| RPS Growth (5Y CAGR) ⓘ | 20.67% | 8.61% |
| EPS Growth (5Y CAGR) ⓘ | N/A | -17.81% |
| BVPS Growth (5Y CAGR) ⓘ | 98.29% | 3.72% |
| Margin Growth (5Y Trend) ⓘ | 6.04% | -0.62% |
| FCF Growth (5Y CAGR) ⓘ | N/A | 1.04% |
| DPS Growth (5Y CAGR) ⓘ | N/A | 6.77% |
Quality (Business durability) | ||
| ROIC (Latest) ⓘ | 2.73% | 3.24% |
| ROA (Latest) ⓘ | -1.59% | 3.01% |
| ROIC (5Y Median) ⓘ | N/A | 4.60% |
| ROA (5Y Median) ⓘ | N/A | 1.89% |
| Net Debt / EBIT (Latest) ⓘ | 15.91 | 1.34 |
| Net Debt / EBIT (5Y Median) ⓘ | 22.58 | 1.84 |
| Net Debt / EBITDA (Latest) ⓘ | 7.91 | 1.00 |
| Net Debt / Assets ⓘ | 50.07% | 5.45% |
| EBITDA / Interest ⓘ | 1.26 | 9.64 |
| Operating Margin (Latest) ⓘ | 5.45% | 9.27% |
| Operating Margin (5Y Median) ⓘ | 5.99% | 7.38% |
| Debt to Equity (Latest) ⓘ | 158.58% | 28.58% |
| Profit Margin (Latest) ⓘ | -2.66% | 3.59% |
| Free Cash Flow (Latest) ⓘ | $31.84M | |
Momentum (Price trend) | ||
| 3Y Return ⓘ | N/A | +42.80% |
| 12M Return (excl. last month) ⓘ | N/A | +18.50% |
| 6M Return ⓘ | +13.12% | +7.57% |
| Price vs. 200-Day MA ⓘ | -5.59% | +5.12% |
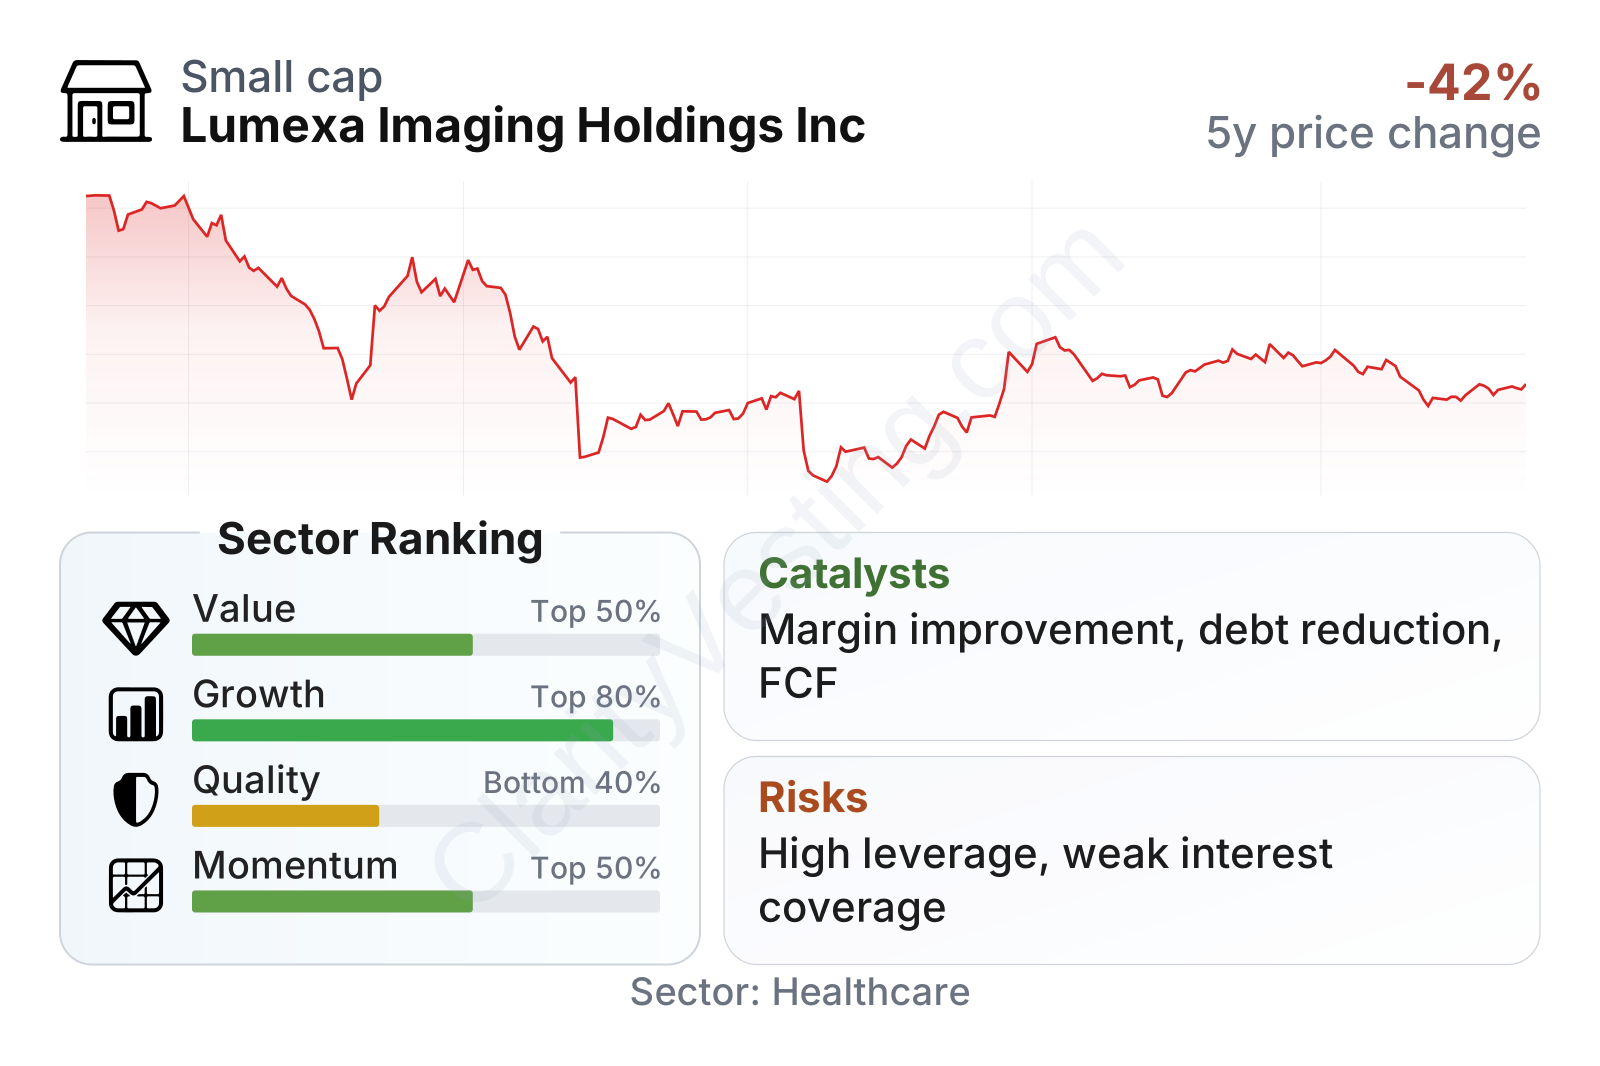
Lumexa’s current profile is mixed. On valuation measures, it screens better than many healthcare peers: price-to-book is below the sector median, free cash flow yield is slightly above the median, and EBIT relative to enterprise value is notably stronger than the typical company in the group. Growth measures are also favorable overall, especially over a five-year period, with revenue per share and book value per share rising much faster than sector norms. The weaker side is business quality: returns on assets and invested capital are below sector medians, profit margin remains negative, and leverage metrics are much heavier than is typical in medical devices.
The share price trend also reflects that tension. After falling sharply from late 2025 into mid-2026, the stock recovered part of the decline by September 2026, but it still remained below its longer-term trend line. That pattern usually signals a company that the market sees as improving operationally, yet still carrying meaningful balance-sheet and earnings-risk questions.
Growth
The company operates in a healthcare segment that benefits from long-term structural demand. Medical imaging remains supported by aging populations, ongoing diagnostic needs, equipment replacement cycles, and the broad push for more efficient clinical workflows. Those are durable industry drivers, because hospitals and outpatient centers continue to rely on imaging hardware and related support regardless of short-term economic swings.
Lumexa’s own recent numbers suggest that its strategy has some logic for future expansion. Annual revenue has moved upward over the last three reported years, while operating income improved from about $22 million in 2023 to roughly $86 million in 2025. Gross profit also increased in 2025 after a softer 2024 result. That combination can indicate better pricing, a more favorable sales mix, improved execution, or tighter cost discipline. Even more encouraging for long-horizon analysis, free cash flow remains positive, which matters because it shows the business is still generating cash despite reported net losses.
Another notable point is the company’s longer-term growth record versus the broader healthcare group. Revenue growth in the most recent year was around 5%, which is below the sector median, but the five-year trend is stronger. Revenue per share growth has substantially outpaced the sector median, and the operating margin trend over five years has improved while the sector median moved slightly lower. That suggests Lumexa has not been a fast short-term grower recently, but it has made meaningful progress over a longer period.
The clearest catalyst is therefore not a single headline event, but continued conversion of revenue growth into operating earnings and cash generation. If operating improvements continue and financing costs become less restrictive over time, the gap between operating performance and net income could narrow further. In a medical device company of this size, that kind of shift can materially change how the market values the business.
No major publicly documented 2026 event from company-hosted materials reviewed appeared to radically change the business outlook in either direction. For now, the important opportunity appears to be internal execution rather than a one-off announcement.
Risks
This article is for informational purposes only and does not constitute financial advice. Some content is AI-generated. See Disclaimer


