Stock Analysis · Lee and Man Paper Manufacturing Limited (LMPMF)
Overview
Lee & Man Paper Manufacturing Limited is a Hong Kong-listed paper producer with major operations in mainland China and a growing presence in Southeast Asia. The company mainly makes containerboard products used in corrugated boxes, along with pulp and tissue paper. In simple terms, it sells the paper materials that are turned into shipping cartons, industrial packaging, consumer goods boxes, and household tissue products.
The business has historically been centered on packaging paper, which remains the core earnings driver. Based on the company’s recent annual reporting structure, revenue is mainly generated from the following activities:
- Packaging paper: approximately 80% to 90% of revenue in recent years. This includes linerboard, corrugating medium, and other containerboard grades used to make cardboard boxes.
- Pulp: approximately 5% to 15% of revenue depending on market conditions. This includes recycled pulp and other pulp products sold internally and externally.
- Tissue paper: generally a smaller share than packaging paper, often in the single-digit to low-teens percentage range. This covers jumbo rolls and finished tissue-related products.
Geographically, China is the main market, but the group has also been expanding manufacturing capacity in countries such as Vietnam and Malaysia to support exports, diversify production, and improve regional supply flexibility.
What matters most for long-term analysis is that Lee & Man operates in an essential but cyclical industry. Box demand is tied to manufacturing, exports, retail distribution, and e-commerce, while pricing depends heavily on industry supply, recovered paper costs, energy costs, and regional capacity additions.
The profit flow over the last several years shows a business that went through a sharp margin squeeze in 2022 and 2023 and then improved again in 2024 and 2025. Revenue has not returned to the 2021 peak, but profitability recovered more clearly than sales, helped by lower financing costs and better gross margin.
Key Figures
| Metric | Value | Sector ⓘ |
|---|---|---|
| Date | Oct 17, 2026 | |
| Context | ||
| Sector | Basic Materials | |
| Industry | Paper & Paper Products | |
| Market Cap ⓘ | $2.02B | |
| Beta ⓘ | 0.99 | |
Value (Cheapness) | ||
| P/E Ratio ⓘ | 6.71 | 16.90 |
| P/B Ratio ⓘ | 0.06 | 1.65 |
| FCF Yield ⓘ | 16.80% | 5.76% |
| Dividend Yield ⓘ | 43.62% | 2.13% |
| EBIT / EV ⓘ | N/A | 6.30% |
| PEG ⓘ | N/A | |
Growth (Business expansion) | ||
| Revenue Growth ⓘ | 21.30% | 11.10% |
| RPS Growth (5Y CAGR) ⓘ | -4.58% | 4.49% |
| EPS Growth (5Y CAGR) ⓘ | -40.42% | -13.47% |
| BVPS Growth (5Y CAGR) ⓘ | -2.03% | 5.51% |
| Margin Growth (5Y Trend) ⓘ | -4.07% | -1.54% |
| FCF Growth (5Y CAGR) ⓘ | N/A | 0.37% |
| DPS Growth (5Y CAGR) ⓘ | -23.86% | 6.08% |
Quality (Business durability) | ||
| ROIC (Latest) ⓘ | 6.42% | 9.26% |
| ROA (Latest) ⓘ | 6.65% | 4.91% |
| ROIC (5Y Median) ⓘ | 3.42% | 7.70% |
| ROA (5Y Median) ⓘ | 2.56% | 3.86% |
| Net Debt / EBIT (Latest) ⓘ | 5.16 | 1.40 |
| Net Debt / EBIT (5Y Median) ⓘ | 9.20 | 1.70 |
| Net Debt / EBITDA (Latest) ⓘ | 3.99 | 0.95 |
| Net Debt / Assets ⓘ | 32.84% | 13.69% |
| EBITDA / Interest ⓘ | 5.59 | 12.34 |
| Operating Margin (Latest) ⓘ | 7.05% | 13.20% |
| Operating Margin (5Y Median) ⓘ | 7.42% | 11.80% |
| Debt to Equity (Latest) ⓘ | 66.14% | 40.56% |
| Profit Margin (Latest) ⓘ | 8.56% | 6.43% |
| Free Cash Flow (Latest) ⓘ | $339.08M | |
Momentum (Price trend) | ||
| 3Y Return ⓘ | +82.67% | +68.89% |
| 12M Return (excl. last month) ⓘ | +74.33% | +30.21% |
| 6M Return ⓘ | +11.90% | -4.16% |
| Price vs. 200-Day MA ⓘ | +10.50% | -1.27% |
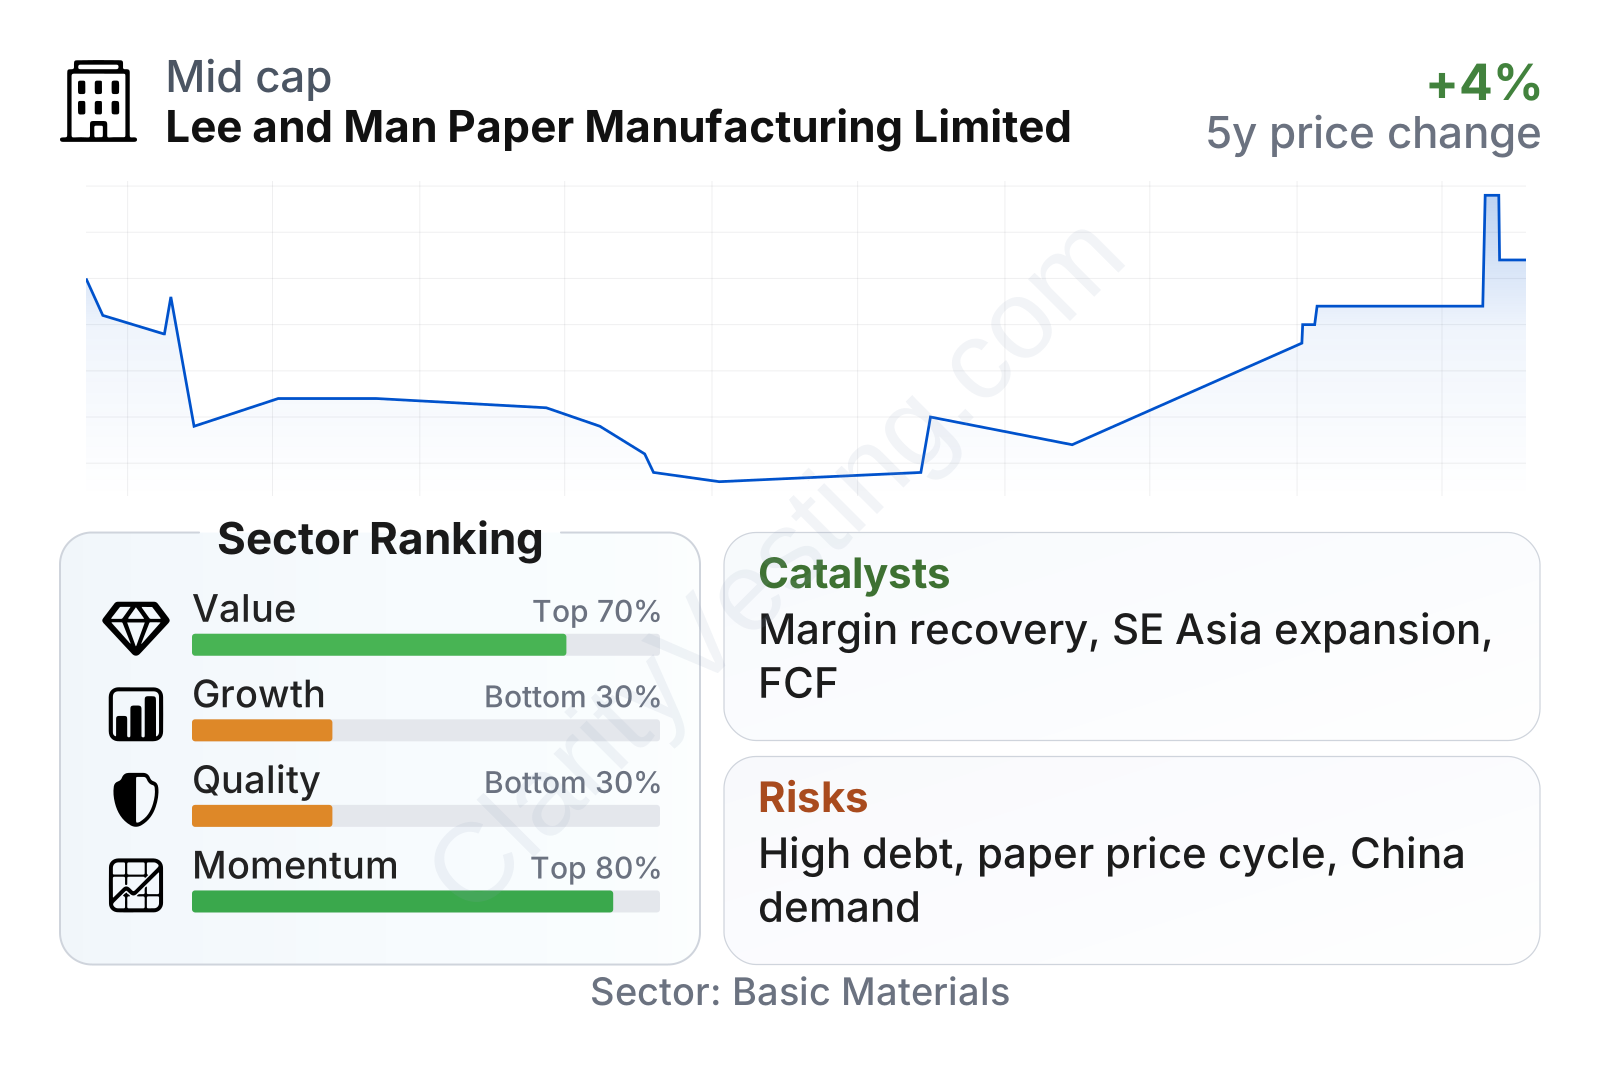
Lee & Man currently screens as a relatively small public company by global materials standards, with a stock-market value around the low single-digit billions of dollars and a beta close to 1, which suggests the share price has broadly moved in line with the wider market rather than showing extreme volatility.
The valuation metrics appear unusually low versus the sector median. Earnings are priced at a mid-single-digit multiple, price-to-book is far below the sector norm, and free-cash-flow yield is materially higher than the industry median. The dividend yield shown is exceptionally high, although that figure should be treated carefully because very high yields can reflect either generous distributions or a depressed share price.
The quality profile is more mixed. Profit margin is decent and return on assets is acceptable, but operating margin sits below the sector median and leverage is clearly elevated. Net debt relative to EBIT and EBITDA is much higher than typical sector levels, and interest coverage is meaningfully weaker than the industry median. That combination makes balance-sheet discipline especially important.
Growth indicators also need a nuanced reading. Recent year-over-year revenue growth has been strong, but the longer five-year trend remains weak, with revenue per share, earnings per share, book value per share, and dividends all showing contraction over that period. In other words, the latest rebound is real, but it follows a difficult multiyear stretch rather than a long uninterrupted expansion.
On market behavior, recent momentum has improved. The stock has outperformed the sector over the last year excluding the latest month, and it has remained above its longer-term moving average. Even so, the longer multiyear price picture is still relatively flat, which fits the company’s uneven earnings cycle.
Growth
Lee & Man operates in a sector with modest structural growth but meaningful cyclical swings. Packaging paper benefits from long-term demand for shipping boxes, logistics, food and beverage packaging, and e-commerce distribution. Tissue paper also has steady underlying consumption, though this segment is not the company’s main profit engine. The broader industry is not a high-growth technology market, but it is tied to basic economic activity and tends to remain relevant over long periods.
The company’s strategy makes sense in that context. Its focus on containerboard keeps it tied to a large, essential packaging category, while overseas manufacturing expansion helps reduce dependence on a single production base. Southeast Asia matters because it can provide access to lower-cost production options, a broader customer footprint, and an additional platform if trade patterns continue shifting across Asia.
There are also visible operational signs of recovery. The company’s revenue improved in the latest annual period, but more importantly, profit recovery was stronger than the top-line increase. Gross profit, operating income, and net income all rebounded from the trough seen in 2022 and 2023. That suggests the business may be benefiting from a better pricing-cost balance rather than relying only on volume growth.
A further catalyst is cash generation. Free cash flow is strong relative to the company’s current market value, which can support debt reduction, dividends, or reinvestment if sustained. In a capital-intensive paper business, improved cash conversion matters because it gives management more flexibility during weaker parts of the cycle.
Another supportive factor is industry normalization after several years of pressure from weaker packaging demand, aggressive capacity additions, and cost volatility. If Chinese industrial activity and export packaging demand continue stabilizing, companies with existing scale and integrated operations could see further earnings recovery without needing dramatic revenue growth.
Risks
This article is for informational purposes only and does not constitute financial advice. Some content is AI-generated. See Disclaimer


