Stock Analysis · Lend Lease Group (LLESF)
Overview
Lendlease Group is an Australian property and infrastructure company whose activities span development, construction, and investment management. In simple terms, it helps plan, build, and manage large urban projects such as residential communities, office towers, mixed-use precincts, and related infrastructure. The group has historically operated across Australia, Asia, Europe, and the Americas, although its more recent strategy has focused on simplifying the business, recycling capital, and concentrating on core markets and projects where it believes returns can be stronger.
The business model combines fee-earning activities with capital-intensive development. That matters because one part of the company earns money from managing projects and investments, while another part depends more heavily on property sales, development completions, asset valuations, and the timing of transactions. This can make reported results look uneven from year to year.
Based on recent annual reporting, Lendlease’s revenue is mainly generated by construction and development-related activity, with smaller contributions from investment management and other property-related operations. Exact percentages can shift materially depending on project timing and disposals, but the latest revenue mix appears to be led by:
- Construction and project delivery: approximately 65% to 75% of revenue. This includes building and delivering major projects for third parties and for Lendlease-led developments.
- Development: approximately 20% to 30% of revenue. This includes residential sales, urban regeneration projects, master-planned communities, and gains linked to project completions or asset sales.
- Investment management and other activities: generally less than 10% of revenue. This includes managing real estate funds, generating management fees, and income tied to property platforms and related services.
One notable pattern in recent years is that revenue has been trending lower after a peak, while profitability has been volatile. That reflects both the reshaping of the group and the lumpy nature of property development, where a few large transactions can heavily influence annual results.
The operating picture has swung sharply over the past several years. Revenue rose through 2023, then moved down in 2024, 2025, and again in 2026. Profitability also moved from losses to a temporary rebound and then back to a sizable loss, showing that the group is still in the middle of a difficult transition rather than delivering a steady earnings profile.
Key Figures
| Metric | Value | Sector ⓘ |
|---|---|---|
| Date | Oct 17, 2026 | |
| Context | ||
| Sector | Real Estate | |
| Industry | Real Estate - Diversified | |
| Market Cap ⓘ | $1.33B | |
| Beta ⓘ | 0.64 | |
Value (Cheapness) | ||
| P/E Ratio ⓘ | N/A | 17.38 |
| P/B Ratio ⓘ | 0.19 | 0.85 |
| FCF Yield ⓘ | -165.09% | 7.38% |
| Dividend Yield ⓘ | 8.18% | 4.85% |
| EBIT / EV ⓘ | N/A | 3.78% |
| PEG ⓘ | N/A | |
Growth (Business expansion) | ||
| Revenue Growth ⓘ | -19.60% | 5.30% |
| RPS Growth (5Y CAGR) ⓘ | -3.18% | 6.02% |
| EPS Growth (5Y CAGR) ⓘ | -9.14% | -11.37% |
| BVPS Growth (5Y CAGR) ⓘ | 0.00% | 0.45% |
| Margin Growth (5Y Trend) ⓘ | N/A | -0.22% |
| FCF Growth (5Y CAGR) ⓘ | N/A | 5.40% |
| DPS Growth (5Y CAGR) ⓘ | 22.62% | 5.02% |
Quality (Business durability) | ||
| ROIC (Latest) ⓘ | N/A | 5.69% |
| ROE (Latest) ⓘ | -10.68% | 7.56% |
| ROA (Latest) ⓘ | -3.55% | 2.85% |
| ROIC (5Y Median) ⓘ | N/A | 4.22% |
| ROE (5Y Median) ⓘ | -3.43% | 6.03% |
| ROA (5Y Median) ⓘ | -1.26% | 2.44% |
| Net Debt / EBIT (Latest) ⓘ | N/A | 7.59 |
| Net Debt / EBIT (5Y Median) ⓘ | N/A | 8.40 |
| Net Debt / EBITDA (Latest) ⓘ | N/A | 5.27 |
| Net Debt / Assets ⓘ | 28.26% | 37.76% |
| EBITDA / Interest ⓘ | N/A | 4.10 |
| Operating Margin (Latest) ⓘ | -3.11% | 35.29% |
| Operating Margin (5Y Median) ⓘ | -0.77% | 37.31% |
| Debt to Equity (Latest) ⓘ | 97.20% | 88.87% |
| Profit Margin (Latest) ⓘ | -13.80% | 19.61% |
| Free Cash Flow (Latest) ⓘ | -$2.19B | |
Momentum (Price trend) | ||
| 3Y Return ⓘ | -47.80% | +30.75% |
| 12M Return (excl. last month) ⓘ | -43.80% | +4.36% |
| 6M Return ⓘ | -16.16% | -2.52% |
| Price vs. 200-Day MA ⓘ | -62.22% | -2.34% |
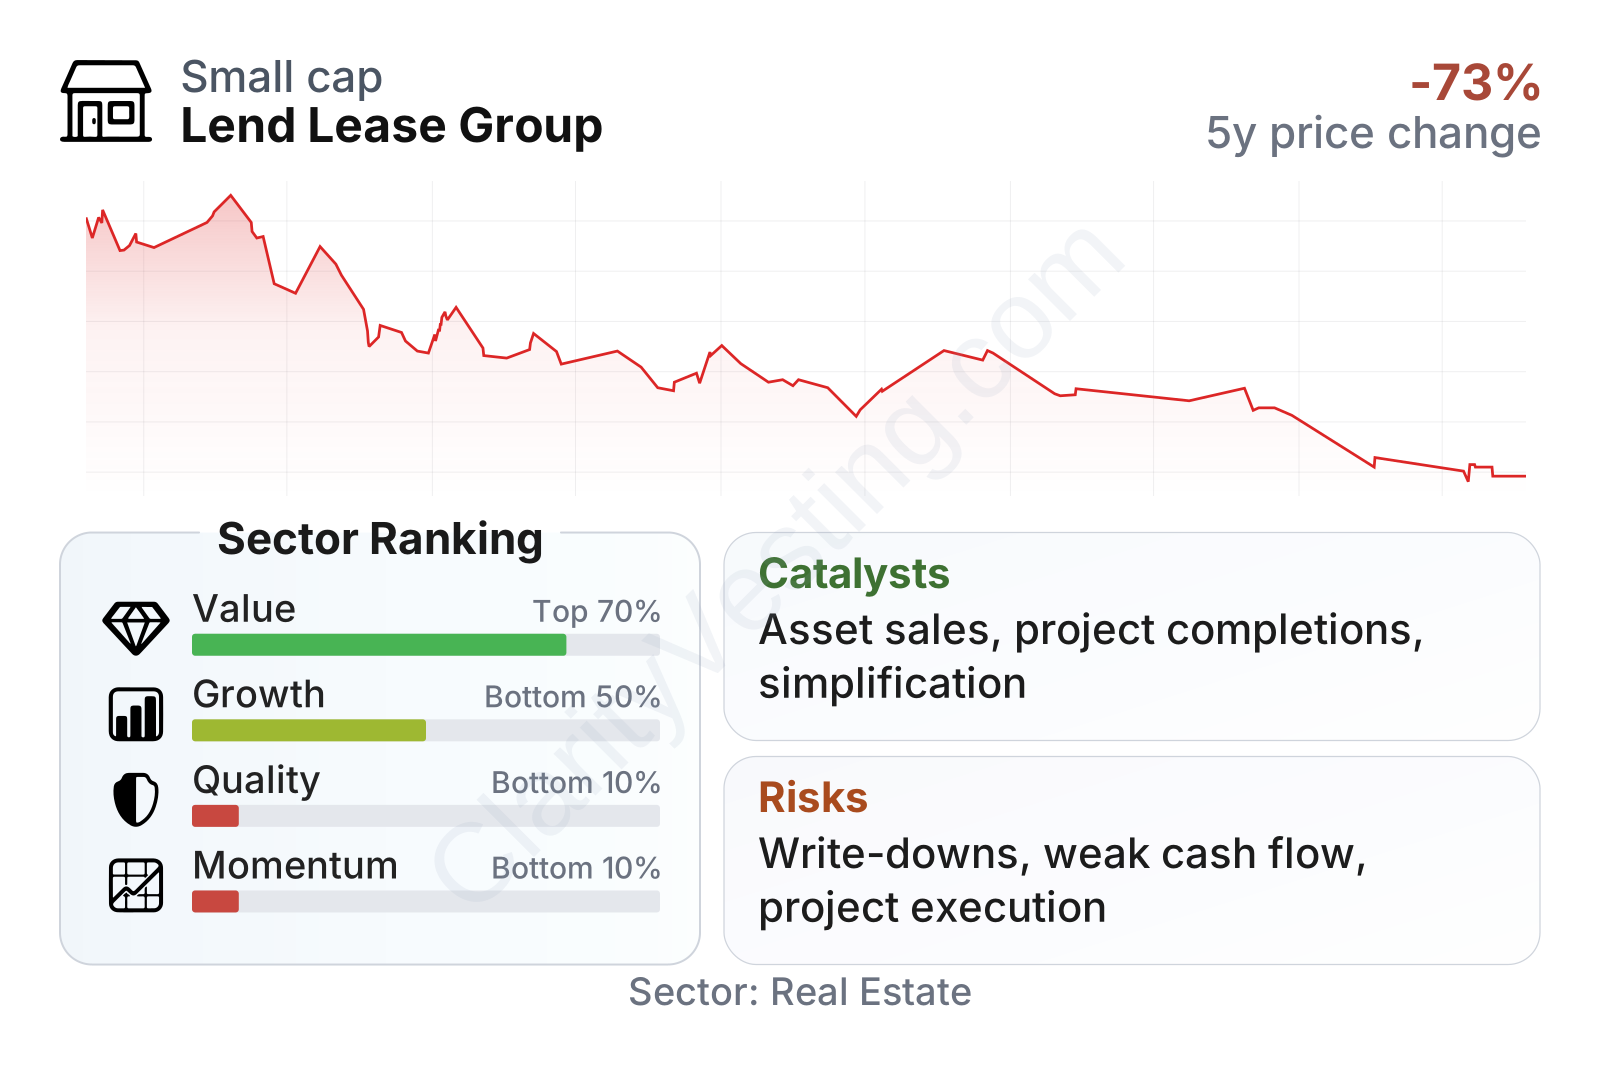
Lendlease is now a relatively small listed real estate name by market value, and its share price has fallen sharply over the last several years. The balance sheet shows leverage that is not extreme for real estate, but operating quality metrics are weak: recent returns on equity and assets are negative, margins are below sector norms, and free cash flow has been deeply negative. On valuation screens, the stock looks inexpensive on book value and offers a high trailing dividend yield, but those signals sit alongside poor momentum and weak operating performance. In other words, the headline cheapness comes with clear underlying strain.
Growth
Lendlease operates in long-cycle sectors that still have structural demand behind them. Housing shortages in major cities, the need for urban redevelopment, transport-linked precincts, and institutional demand for large-scale real assets all support the broader market over time. In that sense, the company is not in a declining industry. The issue is less about demand existing and more about whether Lendlease can convert that demand into stable returns after several years of portfolio reshaping and uneven execution.
Its current strategy broadly makes sense on paper. Management has been simplifying the business, reducing exposure to lower-return or more volatile activities, recycling capital from mature assets, and focusing on core urban regeneration and development platforms. For a company with a complex legacy structure, simplification can be valuable because it can lower overhead, release capital, and make results easier to understand. If successful, that could improve returns over time even if the group becomes smaller.
The long-term revenue-per-share trend has been soft rather than consistently expanding. There was a lift earlier in the period, but the broader picture is one of contraction and instability, which fits with asset sales, project timing effects, and the group’s strategic reset. That means future growth likely depends less on simple top-line expansion and more on better project selection, improved margins, and disciplined capital allocation.
The dividend record has also been uneven. The latest increase stands out, and the trailing yield is elevated, but a high yield in this context should be read carefully because it can reflect a depressed share price as much as income strength. For a cyclical property group with recent losses and negative free cash flow, dividend sustainability matters more than the headline payout level.
Potential catalysts exist. Lendlease has a deep history in large mixed-use and urban regeneration projects, and those projects can unlock value through land monetization, asset sales, development completions, and new capital partnerships. Another possible positive driver is further simplification of the portfolio: if the group continues disposing of non-core assets at acceptable prices and reduces complexity, the market may eventually assign more value to the remaining operations. Recent company communications have also pointed to an ongoing effort to recycle capital and sharpen strategic focus, which is important because the company’s future depends on execution rather than on broad sector growth alone.
Risks
This article is for informational purposes only and does not constitute financial advice. Some content is AI-generated. See Disclaimer


