Stock Analysis · Ethos Technologies Inc (LIFE)
Overview
Ethos Technologies Inc operates a digital life insurance platform. The company is best known for using online underwriting and application tools to help consumers apply for life insurance more quickly, while also giving distribution partners such as financial institutions, agents, and other platforms a way to offer insurance products inside their own customer experience. In simple terms, Ethos sits between customers, partners, and insurance carriers, earning revenue from originating policies and from services tied to those policies.
The business model is built around technology-enabled insurance distribution rather than traditional balance-sheet-heavy insurance ownership. That matters for long-term analysis because it can support faster scaling and lower capital needs than a full insurance carrier model, but it also means results depend heavily on carrier relationships, partner distribution, marketing efficiency, and underwriting performance.
Based on the company’s recent public filings, revenue is primarily generated from insurance-related commissions and fees, with additional contribution from technology and service arrangements connected to policy administration and partner programs. Exact percentages can shift from quarter to quarter, but the revenue mix appears concentrated in a few core streams:
- Commissions and policy origination revenue: the largest source, likely the clear majority of total revenue. This includes income earned when policies are sold through Ethos’s consumer and partner channels.
- Service and administrative revenue: a meaningful but smaller stream tied to ongoing policy support, technology-enabled operations, and carrier or partner arrangements.
- Other revenue: a limited contribution from ancillary activities and smaller contractual arrangements.
One encouraging feature in the recent financial profile is how quickly revenue has expanded while direct costs stayed relatively low. Gross profit remained very high as revenue rose sharply over the last three reported annual periods, which is consistent with a software-enabled distribution model rather than a capital-intensive insurer.
The operating picture improved substantially from 2023 through 2025. Revenue more than doubled over that period, gross profit expanded even faster, and net income turned from almost break-even to a much more meaningful positive level. A notable detail is that selling and administrative costs dropped sharply in 2025 relative to revenue, suggesting the company may be gaining efficiency as it scales.
Key Figures
| Metric | Value | Sector ⓘ |
|---|---|---|
| Date | Oct 24, 2026 | |
| Context | ||
| Sector | Financial Services | |
| Industry | Insurance Brokers | |
| Market Cap ⓘ | $2.87B | |
| Beta ⓘ | N/A | |
Value (Cheapness) | ||
| P/E Ratio ⓘ | N/A | 12.46 |
| P/B Ratio ⓘ | 6.00 | 1.25 |
| FCF Yield ⓘ | 2.55% | 9.82% |
| Dividend Yield ⓘ | N/A | 2.94% |
| EBIT / EV ⓘ | -4.88% | 8.11% |
| PEG ⓘ | N/A | |
Growth (Business expansion) | ||
| Revenue Growth ⓘ | 113.40% | 9.10% |
| RPS Growth (5Y CAGR) ⓘ | 55.72% | 12.31% |
| EPS Growth (5Y CAGR) ⓘ | N/A | -6.97% |
| BVPS Growth (5Y CAGR) ⓘ | -61.05% | 5.02% |
| Margin Growth (5Y Trend) ⓘ | 18.48% | -4.00% |
| FCF Growth (5Y CAGR) ⓘ | N/A | 4.71% |
| DPS Growth (5Y CAGR) ⓘ | N/A | 8.92% |
Quality (Business durability) | ||
| ROIC (Latest) ⓘ | -30.42% | 9.18% |
| ROE (Latest) ⓘ | -49.82% | 13.93% |
| ROA (Latest) ⓘ | -17.97% | 1.57% |
| ROIC (5Y Median) ⓘ | N/A | 7.80% |
| ROE (5Y Median) ⓘ | N/A | 12.15% |
| ROA (5Y Median) ⓘ | N/A | 1.28% |
| Net Debt / EBIT (Latest) ⓘ | N/A | 1.02 |
| Net Debt / EBIT (5Y Median) ⓘ | N/A | 0.72 |
| Net Debt / EBITDA (Latest) ⓘ | N/A | 0.88 |
| Operating Margin (Latest) ⓘ | -16.63% | 22.30% |
| Operating Margin (5Y Median) ⓘ | 20.36% | 24.50% |
| Debt to Equity (Latest) ⓘ | 4.20% | 59.34% |
| Profit Margin (Latest) ⓘ | -18.15% | 26.42% |
| Free Cash Flow (Latest) ⓘ | $73.18M | |
Momentum (Price trend) | ||
| 3Y Return ⓘ | N/A | +95.73% |
| 12M Return (excl. last month) ⓘ | N/A | +17.30% |
| 6M Return ⓘ | +170.20% | +6.07% |
| Price vs. 200-Day MA ⓘ | N/A | +5.36% |
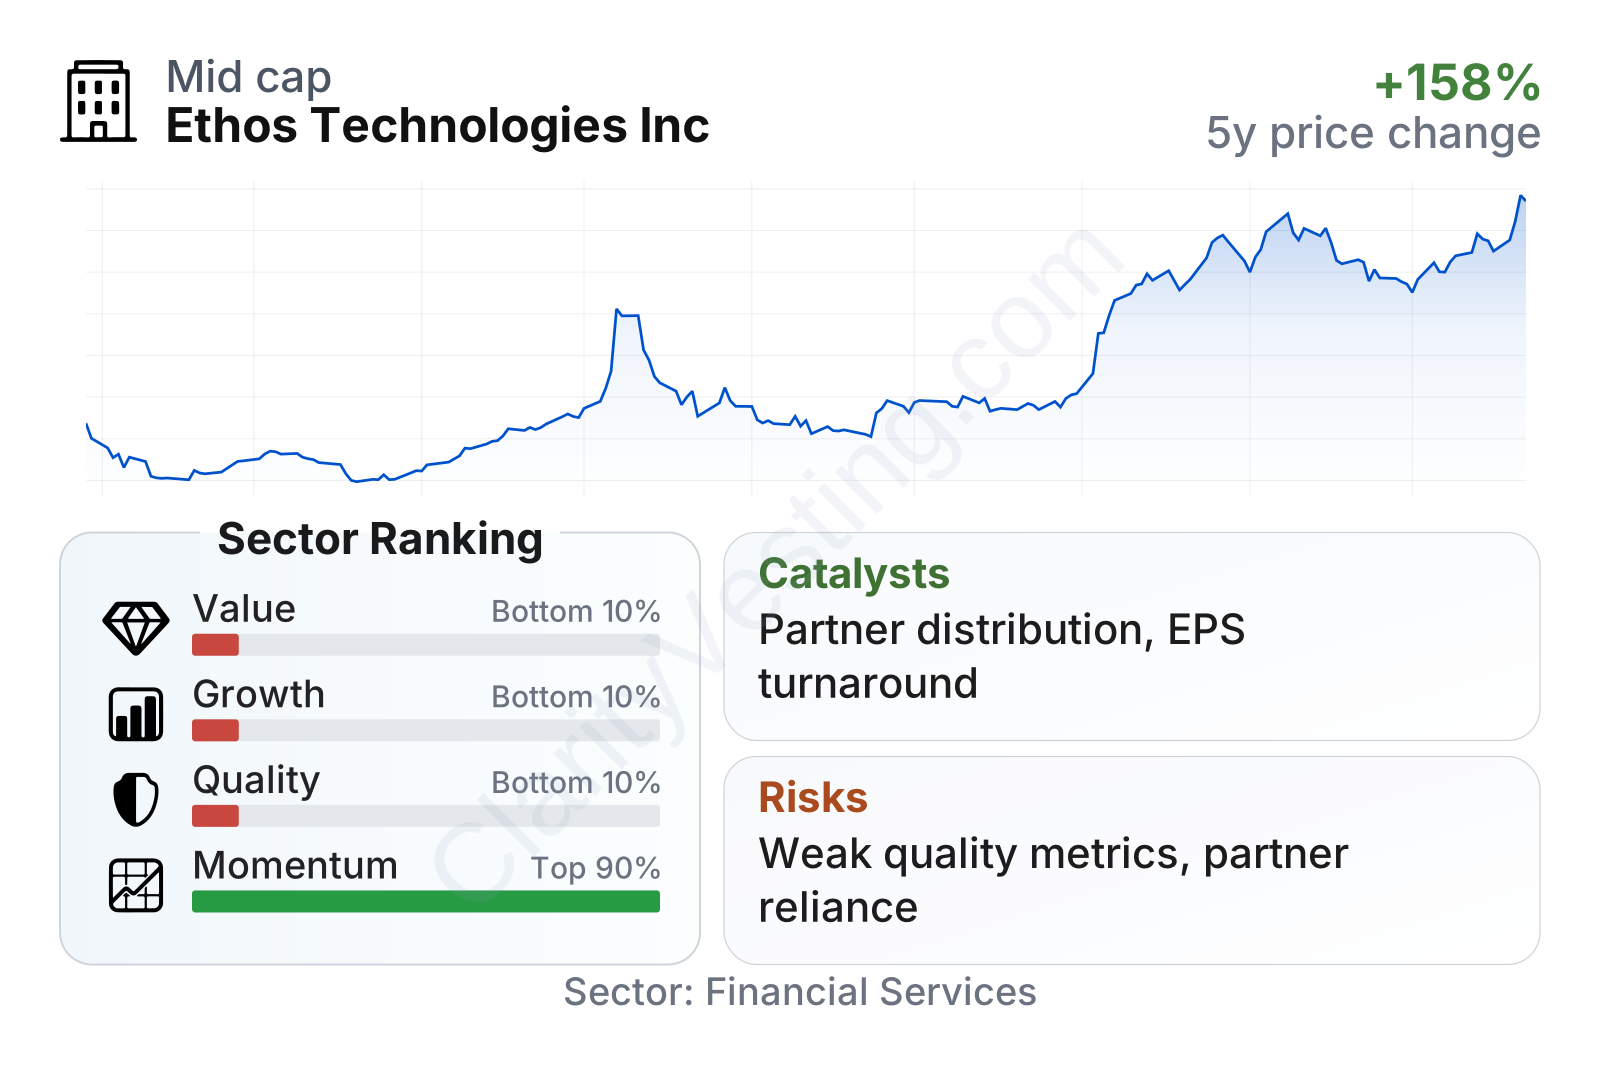
Ethos is now a mid-sized public company by market value, and its recent share price performance has been unusually strong compared with most companies in the broader financial sector. That momentum stands in clear contrast to the fundamental factor rankings, where value, growth, and quality still screen near the bottom of the sector. In practical terms, the market has recently rewarded the turnaround and growth trajectory, but traditional profitability and balance-sheet measures still look weak relative to peers. Free cash flow is positive, leverage appears low with debt to equity near 4%, and the company’s recent price rise has moved the stock well ahead of where standard valuation screens would typically place an insurance broker.
Growth
Ethos operates in a part of financial services that still has room for digital conversion. Life insurance remains a large market, but the buying process has historically been slow, paperwork-heavy, and dependent on agents. Ethos’s approach is aimed at simplifying that process through automation, embedded distribution, and faster underwriting. That gives the company exposure to a long-term industry shift: moving insurance purchasing from offline and manual workflows to digital channels.
The company’s strategy also appears sensible for expansion. It can grow through direct customer acquisition, through partnerships that place its insurance offering inside other consumer platforms, and through better monetization of each policy sold. This is often a powerful model because each additional distribution partner can open access to a new pool of customers without requiring Ethos to build a full local sales force. If underwriting remains efficient and customer acquisition costs stay under control, that structure can support operating leverage.
The earnings trend shows a real improvement. Earnings per share moved from deeply negative levels in 2022 to positive territory by 2025, and remained positive in the 2026 points shown. That shift is important because it suggests the company is no longer relying only on future potential; it has begun to demonstrate that revenue growth can translate into bottom-line results.
Book value per share is still unusual because it remained negative through the periods shown, even though it improved materially. For a fast-growing platform business, investors often focus more on revenue growth, gross margin, and operating leverage than on book value alone, but the negative reading still shows that the company is coming from a weaker capital base than many traditional financial firms.
A major growth catalyst is the possibility of broader adoption by enterprise and affinity partners that want to offer life insurance without building their own infrastructure. Another is continued product and underwriting automation, which can improve approval speed and reduce friction for customers. Recent public company communications have also pointed to continued scaling of distribution relationships and operating discipline, both of which support the case that growth is not coming only from marketing spend.
Risks
This article is for informational purposes only and does not constitute financial advice. Some content is AI-generated. See Disclaimer


