Stock Analysis · Ligand Pharmaceuticals Incorporated (LGND)
Overview
Ligand Pharmaceuticals is a biotechnology company with a business model that is different from most drug developers. Instead of relying mainly on selling one or two medicines itself, Ligand builds, acquires, and licenses pharmaceutical technologies and royalty rights. In practical terms, it helps other drug companies develop products and, in return, collects royalties, milestone payments, and other licensing-related income when those products advance or sell in the market.
This model gives the company exposure to many products across the healthcare sector without bearing the full commercial risk of launching each one alone. Ligand’s portfolio includes royalty interests tied to approved medicines, technology platforms used in drug formulation and discovery, and partnerships that can produce future payments if development programs succeed.
The company’s revenue is spread across several streams, although the mix can shift meaningfully from year to year depending on deal activity, milestones, and the timing of partner sales. Based on recent company disclosures, the main sources of revenue can be summarized as follows:
- Royalties on commercialized products: typically the largest recurring source, often representing roughly 40% to 60% of annual revenue. This includes payments tied to partner product sales, with Captisol-related products and other partnered assets contributing.
- License fees and milestone revenue: often around 20% to 40%, but this category can be volatile. It includes upfront payments, development milestones, regulatory milestones, and other contractual payments from partners.
- Captisol material sales and services: often around 10% to 20%. Captisol is Ligand’s drug formulation technology used to improve how certain medicines are delivered or stabilized.
- Contract payments, research, and other revenue: usually a smaller portion, generally below 10%, depending on the year and partnership activity.
One important feature of the business is that revenue can look uneven in any single quarter or year. A large milestone can temporarily boost results, while the absence of one can make growth appear weak even if the long-term portfolio is improving. That means the business is best understood as a collection of royalty and licensing assets rather than a traditional product-selling pharmaceutical company.
The financial flow also shows a business with very high gross profit characteristics because royalty and licensing income usually carries limited direct production cost. Results have been more volatile at the operating and net income levels, reflecting deal activity, acquisitions, and periodic expense swings, but 2025 marked a sharp rebound in revenue and profitability after weaker years.
Key Figures
| Metric | Value | Sector ⓘ |
|---|---|---|
| Date | Oct 24, 2026 | |
| Context | ||
| Sector | Healthcare | |
| Industry | Biotechnology | |
| Market Cap ⓘ | $6.28B | |
| Beta ⓘ | 1.01 | |
Value (Cheapness) | ||
| P/E Ratio ⓘ | 33.17 | 25.42 |
| P/B Ratio ⓘ | 6.95 | 3.08 |
| FCF Yield ⓘ | 2.09% | 3.12% |
| Dividend Yield ⓘ | N/A | 1.85% |
| EBIT / EV ⓘ | 4.19% | 0.56% |
| PEG ⓘ | 1.53 | |
Growth (Business expansion) | ||
| Revenue Growth ⓘ | 33.70% | 7.50% |
| RPS Growth (5Y CAGR) ⓘ | -1.45% | 8.60% |
| EPS Growth (5Y CAGR) ⓘ | -3.85% | -17.73% |
| BVPS Growth (5Y CAGR) ⓘ | 1.29% | 3.72% |
| Margin Growth (5Y Trend) ⓘ | 21.28% | -0.57% |
| FCF Growth (5Y CAGR) ⓘ | -8.59% | 0.96% |
| DPS Growth (5Y CAGR) ⓘ | N/A | 6.69% |
Quality (Business durability) | ||
| ROIC (Latest) ⓘ | 12.07% | 3.17% |
| ROA (Latest) ⓘ | 10.77% | 2.98% |
| ROIC (5Y Median) ⓘ | 7.91% | 4.56% |
| ROA (5Y Median) ⓘ | 4.30% | 1.87% |
| Net Debt / EBIT (Latest) ⓘ | 0.52 | 1.34 |
| Net Debt / EBIT (5Y Median) ⓘ | 1.13 | 1.86 |
| Net Debt / EBITDA (Latest) ⓘ | 0.46 | 1.00 |
| Net Debt / Assets ⓘ | 5.71% | 5.06% |
| EBITDA / Interest ⓘ | 44.27 | 9.55 |
| Operating Margin (Latest) ⓘ | 82.50% | 9.25% |
| Operating Margin (5Y Median) ⓘ | 38.02% | 7.33% |
| Debt to Equity (Latest) ⓘ | 116.94% | 26.68% |
| Profit Margin (Latest) ⓘ | 67.88% | 3.34% |
| Free Cash Flow (Latest) ⓘ | $131.37M | |
Momentum (Price trend) | ||
| 3Y Return ⓘ | +499.34% | +51.61% |
| 12M Return (excl. last month) ⓘ | +74.80% | +19.90% |
| 6M Return ⓘ | +35.68% | +10.10% |
| Price vs. 200-Day MA ⓘ | +23.50% | +6.44% |
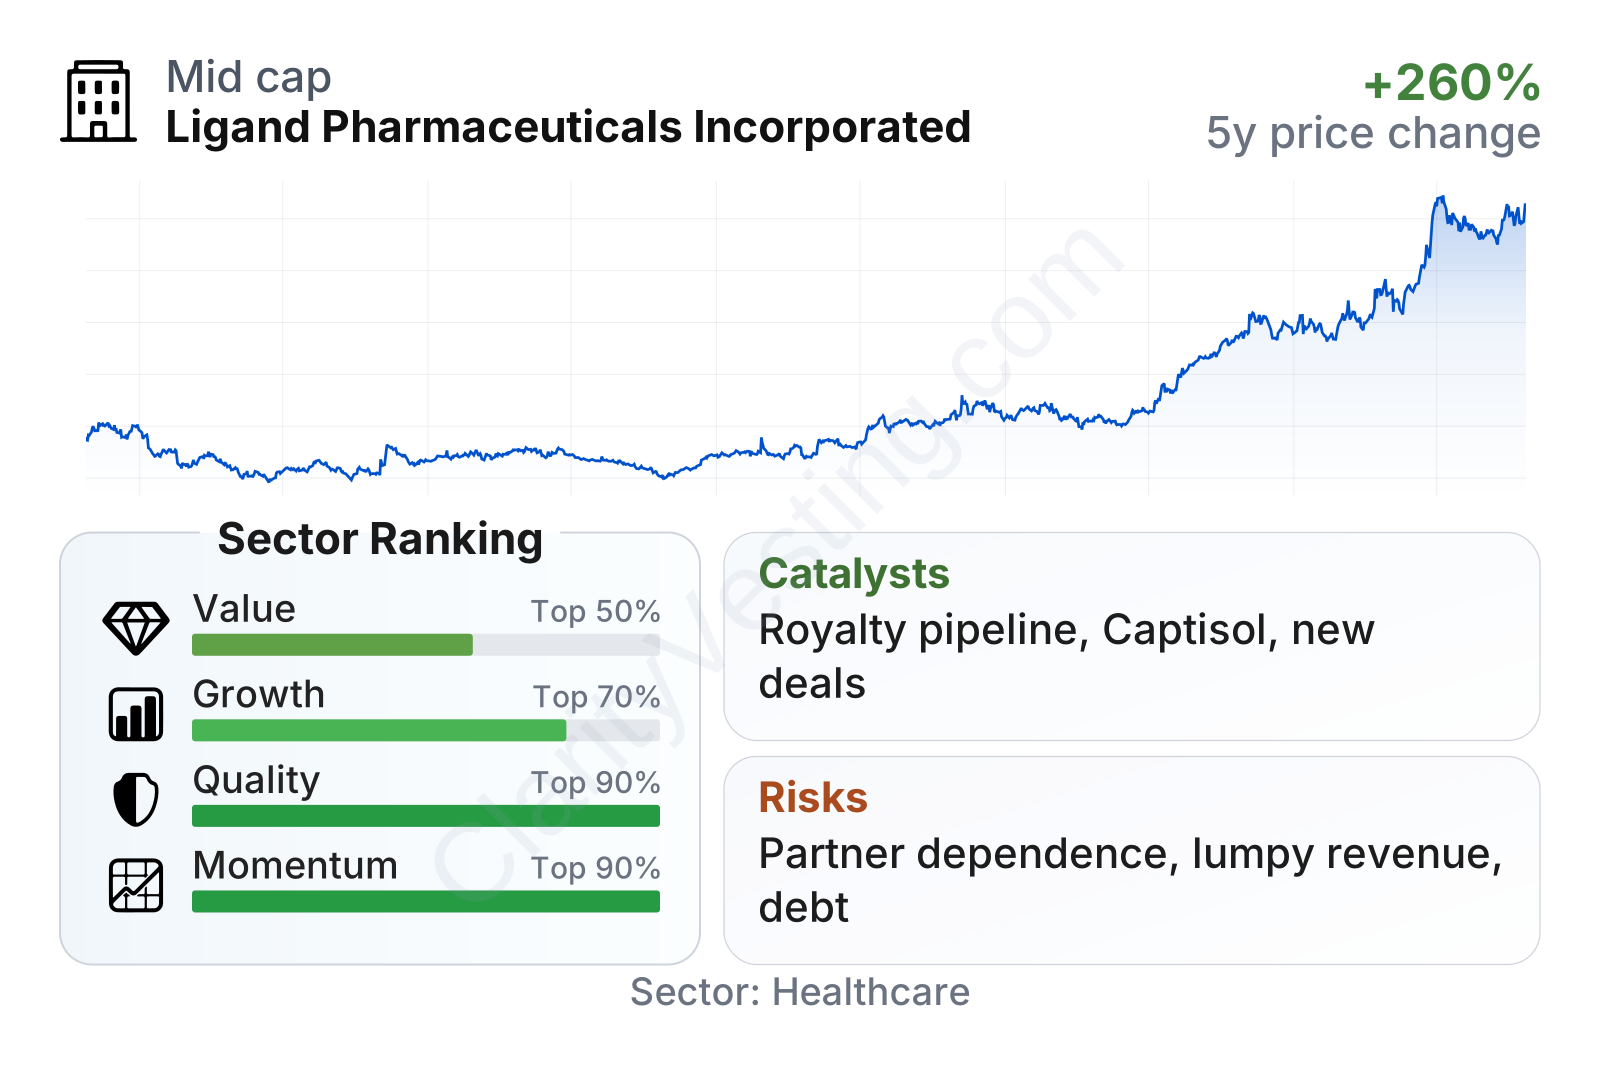
Ligand is a mid-sized biotech company with a market value in the several-billion-dollar range and a stock volatility close to the broader market. Profitability and capital efficiency stand out versus most healthcare peers, with returns on capital and assets well above sector medians. Growth metrics are more mixed: recent revenue growth has been strong, but the longer five-year record remains uneven because of the company’s milestone-driven model. On valuation, the shares trade above the sector median on earnings and well above it on book value, which suggests the market is assigning a premium to the quality of the royalty platform and the improvement in earnings power.
Growth
Ligand operates in a favorable long-term area of healthcare. Drug development continues to expand, and smaller biotechnology companies increasingly depend on financing, partnerships, and external technologies rather than building every capability in-house. That creates room for businesses like Ligand that provide formulation tools, licensing structures, and royalty capital. In that sense, the company is positioned in a growing part of the pharmaceutical ecosystem rather than depending on demand for a single treatment category.
Its strategy also makes sense for long-term expansion. Ligand can add value in several ways: by signing new platform deals, by acquiring royalty interests, by benefiting when partner products move through clinical and regulatory milestones, and by collecting recurring royalties from already-approved medicines. This creates a layered growth model. Some revenues are already in place, some depend on pipeline progress, and some come from new transactions.
Recent growth has been clearly stronger than the sector median, with year-over-year revenue increases running in the double digits and, in some periods, much higher because of milestone timing. That said, the chart also shows why the stock can be difficult to judge from a single quarter: growth has historically been lumpy, with sharp declines followed by equally sharp rebounds. For a long-term view, the key point is that the company has reaccelerated after a softer period.
Cash generation has improved meaningfully. Free cash flow had fallen to a much lower level during the weaker phase but has recovered strongly in the latest trailing period, moving back above $100 million. That matters because Ligand’s model depends not only on accounting profits, but also on having real cash available to fund acquisitions of additional royalty assets, support internal platforms, and preserve balance-sheet flexibility.
A major catalyst is the broad partner pipeline. Ligand has economic interests in a large number of partnered programs, which gives it many shots on goal. The company has also continued building its royalty portfolio through acquisitions and strategic transactions, which can expand future cash flows without forcing it to take full drug development risk. Recent company updates have emphasized progress across partnered assets and contributions from newer acquisitions, reinforcing the idea that future growth may come from multiple smaller drivers rather than one single breakthrough event.
Risks
This article is for informational purposes only and does not constitute financial advice. Some content is AI-generated. See Disclaimer


