Stock Analysis · Legal & General Group Plc (LGGNF)
Overview
Legal & General Group Plc is a large U.K.-based financial services company with three main activities: managing money for institutions and retail clients, selling retirement and protection products, and investing shareholder capital in long-term assets. In practical terms, it helps people save for retirement, provides life insurance and workplace benefits, manages pension-related assets, and works with corporate pension schemes on large risk-transfer transactions.
The group reports its business through major operating divisions rather than a simple product list. Based on the latest annual reporting structure, the business mix is centered on retirement solutions and asset management, with a smaller but still important contribution from protection products and capital-backed activities.
- Retirement Institutional: the largest earnings engine in recent reporting. This includes pension risk transfer, annuities, and related retirement solutions for pension schemes and institutions.
- Asset Management: a major source of fee-based income through Legal & General Investment Management, which oversees index strategies, active fixed income, private markets, and liability-driven solutions for pension and institutional clients.
- Retail / Workplace / Protection: pensions, savings products, life insurance, and workplace benefits sold to individuals and employers in the U.K.
- Capital / Shareholder Investments: income and returns from the group’s own balance sheet investments, including housing, infrastructure, and other long-duration assets that support insurance liabilities and strategic capital deployment.
Precise revenue percentages are not especially useful for Legal & General because accounting revenue in insurers and asset managers can swing with investment markets, assumption changes, and product mix. A better way to view the company is by earnings contribution: retirement-related operations and asset management make up the core of the franchise, while protection and shareholder-backed investment activities provide diversification.
The broad financial picture shows that reported revenue has trended upward over the last several years, but profit conversion has been uneven. That pattern is common in insurers and pension-focused groups because accounting results can move sharply with interest rates, asset values, and reserving assumptions even when the underlying franchise remains stable.
One visible trend is that revenue has expanded over time, while operating income and net income have been much more volatile. That suggests the key issue is not demand for the company’s services, but how efficiently that revenue is turning into profit after market-related movements, financing costs, and other balance-sheet effects.
Key Figures
| Metric | Value | Sector ⓘ |
|---|---|---|
| Date | Oct 03, 2026 | |
| Context | ||
| Sector | Financial Services | |
| Industry | Asset Management | |
| Market Cap ⓘ | $20.89B | |
| Beta ⓘ | 0.79 | |
Value (Cheapness) | ||
| P/E Ratio ⓘ | 25.93 | 12.60 |
| P/B Ratio ⓘ | 11.41 | 1.23 |
| FCF Yield ⓘ | 2.24% | 10.16% |
| Dividend Yield ⓘ | 5.56% | 2.96% |
| EBIT / EV ⓘ | N/A | 7.77% |
| PEG ⓘ | 1.46 | |
Growth (Business expansion) | ||
| Revenue Growth ⓘ | 15.30% | 9.50% |
| RPS Growth (5Y CAGR) ⓘ | -0.02% | 12.10% |
| EPS Growth (5Y CAGR) ⓘ | -30.90% | -9.45% |
| BVPS Growth (5Y CAGR) ⓘ | -36.97% | 5.01% |
| Margin Growth (5Y Trend) ⓘ | -18.03% | -4.07% |
| FCF Growth (5Y CAGR) ⓘ | N/A | 4.96% |
| DPS Growth (5Y CAGR) ⓘ | -2.55% | 8.79% |
Quality (Business durability) | ||
| ROIC (Latest) ⓘ | N/A | 9.60% |
| ROE (Latest) ⓘ | 31.15% | 13.84% |
| ROA (Latest) ⓘ | 0.17% | 1.53% |
| ROIC (5Y Median) ⓘ | 6.66% | 7.86% |
| ROE (5Y Median) ⓘ | 17.06% | 12.20% |
| ROA (5Y Median) ⓘ | 0.09% | 1.29% |
| Net Debt / EBIT (Latest) ⓘ | N/A | 0.91 |
| Net Debt / EBIT (5Y Median) ⓘ | -17.53 | 0.74 |
| Net Debt / EBITDA (Latest) ⓘ | 6.58 | 0.97 |
| Operating Margin (Latest) ⓘ | N/A | 22.12% |
| Operating Margin (5Y Median) ⓘ | 7.75% | 24.39% |
| Debt to Equity (Latest) ⓘ | 1002.04% | 60.37% |
| Profit Margin (Latest) ⓘ | 18.03% | 26.62% |
| Free Cash Flow (Latest) ⓘ | $468.23M | |
Momentum (Price trend) | ||
| 3Y Return ⓘ | +84.38% | +89.23% |
| 12M Return (excl. last month) ⓘ | +28.05% | +17.35% |
| 6M Return ⓘ | +15.90% | +10.00% |
| Price vs. 200-Day MA ⓘ | +11.88% | +3.73% |
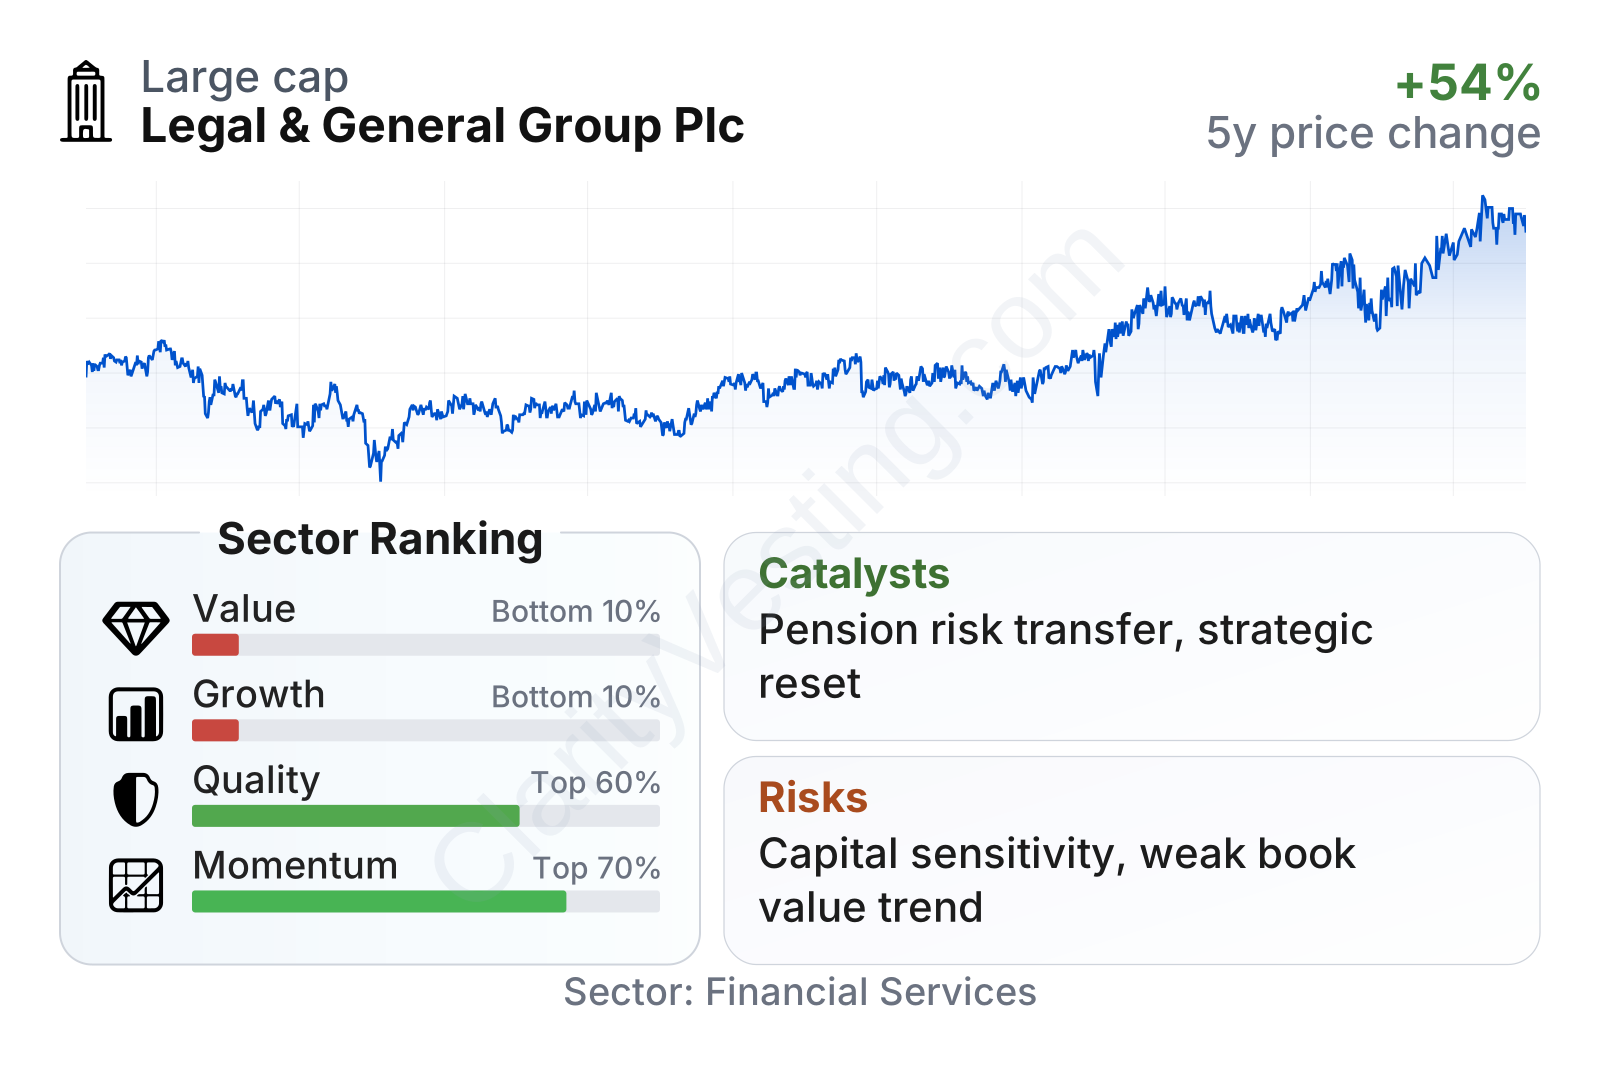
Legal & General is a large financial company with a market value in the tens of billions of dollars and a share price pattern that has generally improved over the last year. Momentum indicators look better than much of the sector, and the stock has been trading above its longer-term average. At the same time, the valuation section of the metrics table appears demanding versus the broader financial sector, especially on price-to-book and earnings multiples.
Quality is more mixed than weak. Return on equity is strong, but that needs to be read carefully because insurers can show elevated ROE when equity is relatively small compared with assets and liabilities. Leverage-related measures are clearly higher than sector norms, which is normal to a degree in insurance, but still worth close attention. Growth metrics are the softest part of the profile: recent revenue growth has been positive, yet the longer five-year pattern for earnings, book value per share, and dividends has been under pressure.
Growth
Legal & General operates in areas with durable long-term demand. Aging populations, the shift from defined benefit pensions to retirement income products, the need for pension de-risking, and the steady rise of workplace savings all support the sector. Institutions continue to look for ways to transfer pension obligations, and insurers with scale, underwriting expertise, and long-dated investment capabilities are well placed to capture that demand.
The company’s strategy also makes industrial sense. Its retirement business benefits from corporate pension schemes seeking certainty on future obligations. Its asset-management arm gives it distribution, client relationships, and investment expertise. Its balance sheet can be deployed into long-term assets that fit insurance liabilities. This combination can create a useful loop: insurance liabilities generate investable assets, asset management adds fee income, and scale can improve pricing and execution in pension transactions.
A notable catalyst is the U.K. and global pension risk transfer market, where transaction volumes have remained structurally attractive. Legal & General has been one of the better-known participants in this area for years, and continued demand from pension trustees could support new business generation. Another catalyst is execution under the group’s current strategic reset, which has emphasized simplification, capital discipline, and sharpening the focus on higher-return businesses.
There is also a balance-sheet angle to the growth question. For insurers, book value matters because it helps show how much capital is backing the business. Here the trend is less encouraging than the sector average.
Book value per share has moved down materially over the last several years. That does not automatically mean the core franchise is deteriorating, since insurance accounting can be heavily affected by market movements and capital actions, but it does mean future growth needs to be supported by strong operating execution rather than by a steadily expanding equity base.
Recent company updates have also pointed to active portfolio management, including reshaping operations and releasing capital from non-core activities. If management can improve cash generation and keep writing attractive retirement business without stretching the balance sheet, that would be a meaningful opportunity for the next phase of the company’s development.
Risks
This article is for informational purposes only and does not constitute financial advice. Some content is AI-generated. See Disclaimer


