Stock Analysis · Life & Banc Split Corp (LFBCF)
Overview
Life & Banc Split Corp is not a traditional operating company with stores, factories, or a broad product lineup. It is a Canadian split share corporation that holds a portfolio of large financial-services and insurance stocks, mainly from Canada. Its structure is designed to issue two classes of shares: preferred shares, which target fixed distributions and capital protection priorities, and class A shares, which receive the remaining upside and typically higher distributions when the portfolio performs well.
In practical terms, the business is an investment vehicle. Its results mainly come from the performance of the underlying stock portfolio rather than from selling products or services. That makes the company easier to understand at a high level: when the value of its holdings rises and dividends are received from those holdings, Life & Banc Split Corp generally benefits; when financial stocks fall, its net asset value can move down quickly.
The main economic sources behind its results are typically the following:
- Unrealized and realized gains on investments: usually the largest driver over time, coming from changes in the market value of the portfolio and gains or losses when holdings are sold.
- Dividend and distribution income from portfolio holdings: cash income received from the banks, insurers, and related financial companies in the portfolio.
- Option or portfolio management related income, if used: depending on the structure and reporting period, this can add incremental income but is usually not the main driver.
Because Life & Banc Split Corp reports like an investment company, exact year-to-year revenue mix percentages are less useful than for a normal operating business. In some years, accounting results are dominated by mark-to-market gains, while in weaker markets they can swing negative. Recent results reflect that pattern: large gains in 2024 and 2025 followed earlier volatility, while operating expenses remained comparatively small against portfolio movements. That means the company’s economics are driven far more by asset values than by cost control alone.
The visual summary highlights an important feature of this business: expenses have stayed relatively modest, while reported income has been highly volatile because portfolio gains and losses flow through results. For a long-term reader, book value and net asset value trends matter more than a traditional sales-and-margin reading.
Key Figures
| Metric | Value | Sector ⓘ |
|---|---|---|
| Date | Oct 17, 2026 | |
| Context | ||
| Sector | Financial Services | |
| Industry | Asset Management | |
| Market Cap ⓘ | $1.10B | |
| Beta ⓘ | 1.29 | |
Value (Cheapness) | ||
| P/E Ratio ⓘ | 1.57 | 12.26 |
| P/B Ratio ⓘ | 0.43 | 1.23 |
| FCF Yield ⓘ | 1.62% | 10.40% |
| Dividend Yield ⓘ | 12.65% | 3.02% |
| EBIT / EV ⓘ | N/A | 8.14% |
| PEG ⓘ | N/A | |
Growth (Business expansion) | ||
| Revenue Growth ⓘ | 282.00% | 9.35% |
| RPS Growth (5Y CAGR) ⓘ | -23.63% | 12.19% |
| EPS Growth (5Y CAGR) ⓘ | 14.04% | -9.53% |
| BVPS Growth (5Y CAGR) ⓘ | 15.26% | 4.99% |
| Margin Growth (5Y Trend) ⓘ | 10.42% | -3.86% |
| FCF Growth (5Y CAGR) ⓘ | -36.91% | 4.81% |
| DPS Growth (5Y CAGR) ⓘ | 12.60% | 8.79% |
Quality (Business durability) | ||
| ROIC (Latest) ⓘ | N/A | 9.49% |
| ROE (Latest) ⓘ | 107.00% | 13.90% |
| ROA (Latest) ⓘ | 60.11% | 1.55% |
| ROIC (5Y Median) ⓘ | N/A | 7.86% |
| ROE (5Y Median) ⓘ | 43.10% | 12.17% |
| ROA (5Y Median) ⓘ | 19.85% | 1.30% |
| Net Debt / EBIT (Latest) ⓘ | N/A | 0.96 |
| Net Debt / EBIT (5Y Median) ⓘ | 2.26 | 0.73 |
| Net Debt / EBITDA (Latest) ⓘ | N/A | 0.92 |
| Operating Margin (Latest) ⓘ | N/A | 22.30% |
| Operating Margin (5Y Median) ⓘ | 84.34% | 24.63% |
| Debt to Equity (Latest) ⓘ | 62.60% | 58.56% |
| Profit Margin (Latest) ⓘ | 91.89% | 26.57% |
| Free Cash Flow (Latest) ⓘ | $17.81M | |
Momentum (Price trend) | ||
| 3Y Return ⓘ | +189.58% | +88.33% |
| 12M Return (excl. last month) ⓘ | +77.98% | +19.38% |
| 6M Return ⓘ | +21.68% | +4.75% |
| Price vs. 200-Day MA ⓘ | +125.26% | +3.50% |
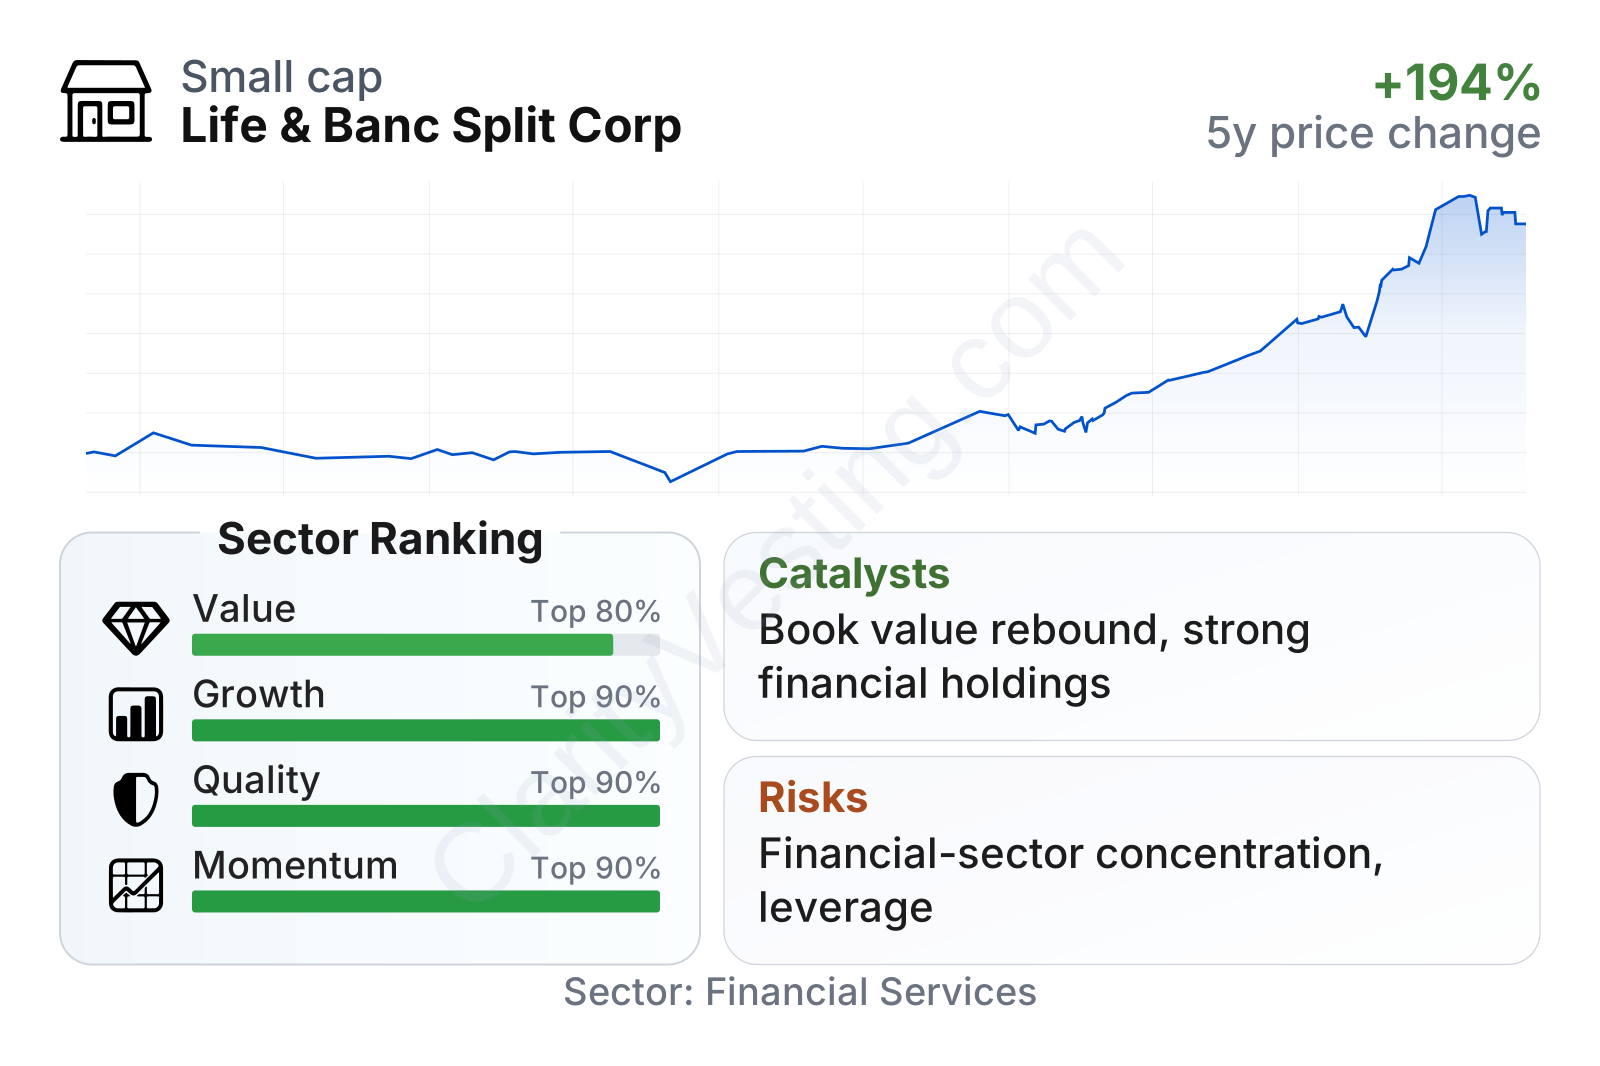
The company screens as unusually strong on growth, quality, and momentum relative to much of the financial-services sector, but those signals need to be interpreted carefully because this is a portfolio vehicle, not a conventional asset manager with recurring management fees as its main engine. Profitability ratios and recent returns look very high, the dividend yield is elevated at about 12%, and valuation multiples such as price-to-earnings and price-to-book look low versus sector medians. At the same time, free cash flow yield is weaker than the sector median, and historical performance has been uneven over a longer period, especially when measured through revenue-related lines that can swing sharply with market prices.
The stock price trend has been notably strong over the past several years, rising from under $3 in late 2021 to above $9 in late 2026. That move broadly matches the recovery in book value and the rerating of the shares closer to underlying asset value.
Growth
Life & Banc Split Corp is tied to a sector that remains structurally important: large banks, life insurers, and diversified financial companies. These businesses benefit from long-term demand for lending, wealth management, retirement products, and insurance coverage. For this company, growth does not come from opening new branches or launching a major consumer platform. It comes from the underlying holdings increasing in value, paying dividends, and potentially compounding book value over time.
That setup can make sense when the portfolio is focused on established financial institutions with durable earnings power. If interest rate conditions remain supportive, credit quality stays stable, and insurers continue benefiting from investment income and pricing discipline, the portfolio can keep building value. The biggest practical catalyst is therefore not a single product launch, but continued strength in Canadian financial stocks and the income they distribute.
Book value per share is a particularly important measure here because it shows whether the underlying asset base is actually compounding. After a drop in 2022, book value recovered in 2023, moved above the 2021 level in 2024, and then climbed sharply again in 2025. That pattern suggests the portfolio did more than simply recover lost ground; it materially expanded its per-share value over the most recent period.
Another notable point is that the company’s five-year book value per share growth rate is well above the sector median, and dividend per share growth has also been strong. Those are useful signs for a split share structure because they indicate that the asset base and distribution capacity have improved together, at least in recent years.
As for recent opportunity signals, the strongest one is internal rather than headline-driven: recent financial results and book value progression indicate that the portfolio has benefited from favorable market conditions. The company has also participated in a period when major North American financial stocks have generally regained strength after the volatility of 2022. For a structure like this, that macro backdrop is often more important than company-specific expansion plans.
Risks
This article is for informational purposes only and does not constitute financial advice. Some content is AI-generated. See Disclaimer


