Stock Analysis · Legend Biotech Corp (LEGN)
Overview
Legend Biotech Corp is a biotechnology company focused on cell therapies, especially treatments that use a patient’s own immune cells to attack cancer. Its best-known product is CARVYKTI, a CAR-T therapy for multiple myeloma developed with Johnson & Johnson’s Janssen unit. The company also has earlier-stage programs in blood cancers, solid tumors, and autoimmune diseases, but the commercial business today is still centered on one major product.
For long-term analysis, the key point is that Legend is no longer a purely research-stage biotech. It already has meaningful commercial revenue, but the business still behaves financially like a growth biotech because it continues to spend heavily on research, manufacturing scale-up, and commercialization.
The company’s revenue base is concentrated and can be summarized as follows:
- Collaboration and license revenue tied mainly to CARVYKTI: roughly the vast majority of total revenue. This includes profit-sharing, development and commercialization collaboration economics, and other revenue recognized under the partnership structure with Janssen.
- Other revenue: a small minority of total revenue. This generally includes limited service-related or ancillary items and is not the main driver of the business.
Over the last several years, the business mix has become more commercial. Total revenue increased from about $69 million in 2021 to about $627 million in 2024, and then to roughly $1.03 billion in 2025. That shift matters because it shows Legend is moving from development-stage funding toward product-based revenue generation, even though profitability has not yet become steady.
The cost structure also shows what kind of company Legend is. Research and development remains very high, at more than $400 million in 2024 and again in 2025, while selling and administrative costs have also risen as the company supports a broader commercial footprint. In other words, revenue has scaled quickly, but management is still investing aggressively rather than optimizing for near-term earnings.
The long-term trend is encouraging on the revenue side: sales have expanded sharply and gross profit has improved meaningfully. At the same time, operating expenses have remained large, especially in research and development, which explains why net income is still negative despite much higher revenue.
Key Figures
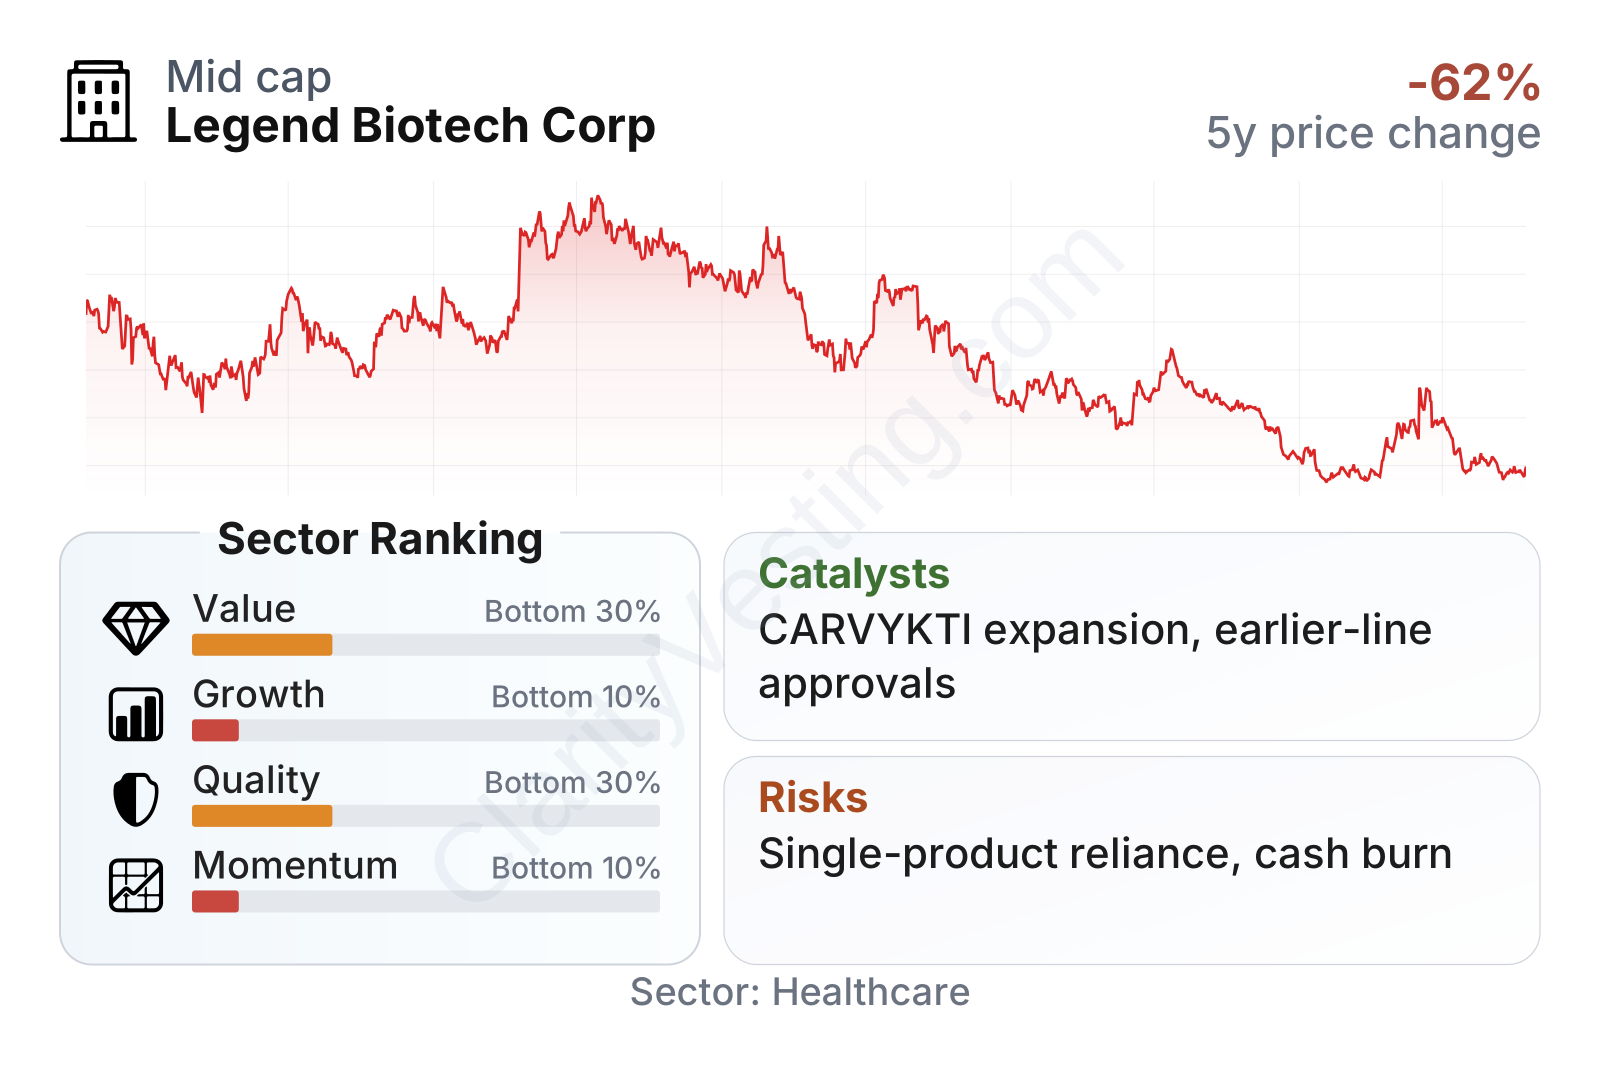
The share price history shows a stock that has been volatile and, over the last few years, clearly under pressure. That is common in biotechnology when commercial progress is real but the path to durable profitability remains uncertain.
| Metric | Value | Sector ⓘ |
|---|---|---|
| Date | Oct 17, 2026 | |
| Context | ||
| Sector | Healthcare | |
| Industry | Biotechnology | |
| Market Cap ⓘ | $3.70B | |
| Beta ⓘ | 0.57 | |
Value (Cheapness) | ||
| P/E Ratio ⓘ | N/A | 24.79 |
| P/B Ratio ⓘ | 3.12 | 3.08 |
| FCF Yield ⓘ | -6.90% | 3.15% |
| Dividend Yield ⓘ | N/A | 1.94% |
| EBIT / EV ⓘ | -1.48% | 0.57% |
| PEG ⓘ | N/A | |
Growth (Business expansion) | ||
| Revenue Growth ⓘ | 51.90% | 7.45% |
| RPS Growth (5Y CAGR) ⓘ | 83.85% | 8.61% |
| EPS Growth (5Y CAGR) ⓘ | -63.15% | -17.81% |
| BVPS Growth (5Y CAGR) ⓘ | -0.01% | 3.72% |
| Margin Growth (5Y Trend) ⓘ | N/A | -0.62% |
| FCF Growth (5Y CAGR) ⓘ | -8.89% | 1.04% |
| DPS Growth (5Y CAGR) ⓘ | N/A | 6.77% |
Quality (Business durability) | ||
| ROIC (Latest) ⓘ | -3.35% | 3.24% |
| ROA (Latest) ⓘ | -5.29% | 3.01% |
| ROIC (5Y Median) ⓘ | -30.63% | 4.60% |
| ROA (5Y Median) ⓘ | -32.60% | 1.89% |
| Net Debt / EBIT (Latest) ⓘ | N/A | 1.34 |
| Net Debt / EBIT (5Y Median) ⓘ | N/A | 1.84 |
| Net Debt / EBITDA (Latest) ⓘ | -191.98 | 1.00 |
| Net Debt / Assets ⓘ | -22.54% | 5.45% |
| EBITDA / Interest ⓘ | 0.12 | 9.64 |
| Operating Margin (Latest) ⓘ | -3.39% | 9.27% |
| Operating Margin (5Y Median) ⓘ | -174.76% | 7.38% |
| Debt to Equity (Latest) ⓘ | 22.63% | 28.58% |
| Profit Margin (Latest) ⓘ | -7.20% | 3.59% |
| Free Cash Flow (Latest) ⓘ | -$255.58M | |
Momentum (Price trend) | ||
| 3Y Return ⓘ | -71.61% | +42.80% |
| 12M Return (excl. last month) ⓘ | -47.85% | +18.50% |
| 6M Return ⓘ | -3.51% | +7.57% |
| Price vs. 200-Day MA ⓘ | -11.02% | +5.12% |
Legend’s profile is mixed. Growth in revenue has been far stronger than the healthcare sector median, but the company still ranks poorly on value, quality, and momentum because earnings, margins, and cash flow remain negative. Its market value places it in the mid-cap range rather than among the largest biotechnology names, and its relatively low beta suggests the stock has not moved as violently as some biotech peers even though the longer-term return has been weak.
Growth
Legend operates in one of the most important areas of modern medicine: engineered cell therapy. This is a growing segment of oncology because it addresses hard-to-treat cancers with highly personalized treatments that can produce deep responses in some patients. The broader sector still faces manufacturing complexity and high cost, but the medical need remains large, especially in blood cancers.
Legend’s strategy is logical for future growth. Rather than trying to build an oncology platform alone from scratch, it partnered on CARVYKTI with a much larger global pharmaceutical company. That gives it access to commercialization muscle, manufacturing support, and broader market reach while still preserving meaningful economics for Legend. For a company of this size, that partnership model reduces some execution burden.
The biggest growth driver remains CARVYKTI. Expansion can come from three directions: wider physician adoption in approved settings, additional geographic reach, and movement into earlier lines of therapy if regulators and clinical data continue to support that path. In oncology, moving a product earlier in treatment can substantially expand the eligible patient pool.
Revenue growth has remained strong even as the company has become larger. The recent pace, around the low-50% range year over year, is slower than the exceptional spikes seen earlier but still far above the sector median. That suggests commercial momentum is continuing, though naturally on a less explosive base than in the launch phase.
There is also a second layer to the growth case beyond current sales. Legend has been working on additional pipeline programs in cell therapy, including opportunities outside multiple myeloma. If even one additional program reaches late-stage success, the company could become less dependent on a single flagship asset. That would be strategically important because single-product biotechnology companies often face sharp valuation swings.
Cash generation has improved somewhat from earlier periods, but free cash flow is still negative, with trailing twelve-month cash burn remaining in the hundreds of millions of dollars. This means growth is real, but it is not yet self-funding. The commercial ramp is helping, though the business still needs scale and operating leverage to convert strong top-line expansion into durable cash production.
A meaningful recent opportunity for the company is the continued broadening of CARVYKTI’s clinical and commercial reach. Public company updates in 2026 have continued to emphasize manufacturing expansion, treatment capacity, and development progress in earlier lines of therapy. For Legend, that matters as much as demand itself, because cell therapy growth is often limited not by patient interest but by the ability to produce and deliver treatment reliably.
Risks
This article is for informational purposes only and does not constitute financial advice. Some content is AI-generated. See Disclaimer


