Stock Analysis · London Stock Exchange Group plc (LDNXF)
Overview
London Stock Exchange Group plc, or LSEG, is a financial markets infrastructure company. In simple terms, it helps global investors, banks, asset managers, corporations, and governments trade securities, clear and settle transactions, raise capital, and access financial data and analytics. Over time, the business has become much more than a traditional stock exchange. Today, a large part of its value comes from subscription-like data, index, and workflow services that tend to be more recurring than trading revenue.
LSEG organizes its business into several major divisions. Based on recent annual reporting, the largest sources of revenue are approximately:
- Data & Analytics: about 40% to 45% — financial data feeds, desktop products, analytics, and trading workflow tools used by banks, asset managers, and other institutions. This includes the former Refinitiv activities.
- FTSE Russell: about 15% to 20% — index products, benchmarks, and analytics used in ETFs, asset allocation, and investment products. Revenue can benefit from assets linked to its indexes.
- Post Trade: about 15% to 20% — clearing, risk management, and settlement-related services, mainly through LCH and other infrastructure operations.
- Markets: about 10% to 15% — trading venues for equities, fixed income, foreign exchange, and other asset classes.
- Risk Intelligence: about 10% to 15% — compliance, screening, and fraud-related information and tools used by institutions to manage financial crime and regulatory obligations.
This mix matters because it gives LSEG a more diversified profile than a pure exchange operator. Revenue is not driven only by daily trading volumes. A significant share comes from recurring subscriptions, benchmark licensing, and mission-critical infrastructure, which can make results more resilient.
Over the last several years, revenue has trended upward, while profitability has been influenced by integration costs, amortization, financing costs, and accounting effects tied to the Refinitiv acquisition. The broad direction, however, has been toward a larger and more data-centered business.
The long-term pattern shows steady revenue expansion from roughly $6.5 billion in 2021 to above $9 billion by 2025, with operating income improving as the business scales. Net income has been much more uneven, which suggests that headline earnings need to be read alongside cash generation and operating performance rather than in isolation.
Key Figures
| Metric | Value | Sector ⓘ |
|---|---|---|
| Date | Oct 17, 2026 | |
| Context | ||
| Sector | Financial Services | |
| Industry | Financial Data & Stock Exchanges | |
| Market Cap ⓘ | $52.89B | |
| Beta ⓘ | 0.41 | |
Value (Cheapness) | ||
| P/E Ratio ⓘ | 29.13 | 12.26 |
| P/B Ratio ⓘ | 3.07 | 1.23 |
| FCF Yield ⓘ | 12.02% | 10.40% |
| Dividend Yield ⓘ | 1.45% | 3.02% |
| EBIT / EV ⓘ | N/A | 8.14% |
| PEG ⓘ | 0.75 | |
Growth (Business expansion) | ||
| Revenue Growth ⓘ | 6.70% | 9.35% |
| RPS Growth (5Y CAGR) ⓘ | 2.08% | 12.19% |
| EPS Growth (5Y CAGR) ⓘ | -49.50% | -9.53% |
| BVPS Growth (5Y CAGR) ⓘ | -13.48% | 4.99% |
| Margin Growth (5Y Trend) ⓘ | 2.19% | -3.86% |
| FCF Growth (5Y CAGR) ⓘ | 15.87% | 4.81% |
| DPS Growth (5Y CAGR) ⓘ | 6.45% | 8.79% |
Quality (Business durability) | ||
| ROIC (Latest) ⓘ | N/A | 9.49% |
| ROE (Latest) ⓘ | 12.15% | 13.90% |
| ROA (Latest) ⓘ | 0.30% | 1.55% |
| ROIC (5Y Median) ⓘ | 4.68% | 7.86% |
| ROE (5Y Median) ⓘ | 5.48% | 12.17% |
| ROA (5Y Median) ⓘ | 0.16% | 1.30% |
| Net Debt / EBIT (Latest) ⓘ | 2.00 | 0.96 |
| Net Debt / EBIT (5Y Median) ⓘ | 3.68 | 0.73 |
| Net Debt / EBITDA (Latest) ⓘ | 1.04 | 0.92 |
| Operating Margin (Latest) ⓘ | 24.99% | 22.30% |
| Operating Margin (5Y Median) ⓘ | 21.14% | 24.63% |
| Debt to Equity (Latest) ⓘ | 72.25% | 58.56% |
| Profit Margin (Latest) ⓘ | 14.64% | 26.57% |
| Free Cash Flow (Latest) ⓘ | $6.36B | |
Momentum (Price trend) | ||
| 3Y Return ⓘ | +18.38% | +88.33% |
| 12M Return (excl. last month) ⓘ | -4.21% | +19.38% |
| 6M Return ⓘ | -8.01% | +4.75% |
| Price vs. 200-Day MA ⓘ | -1.01% | +3.50% |
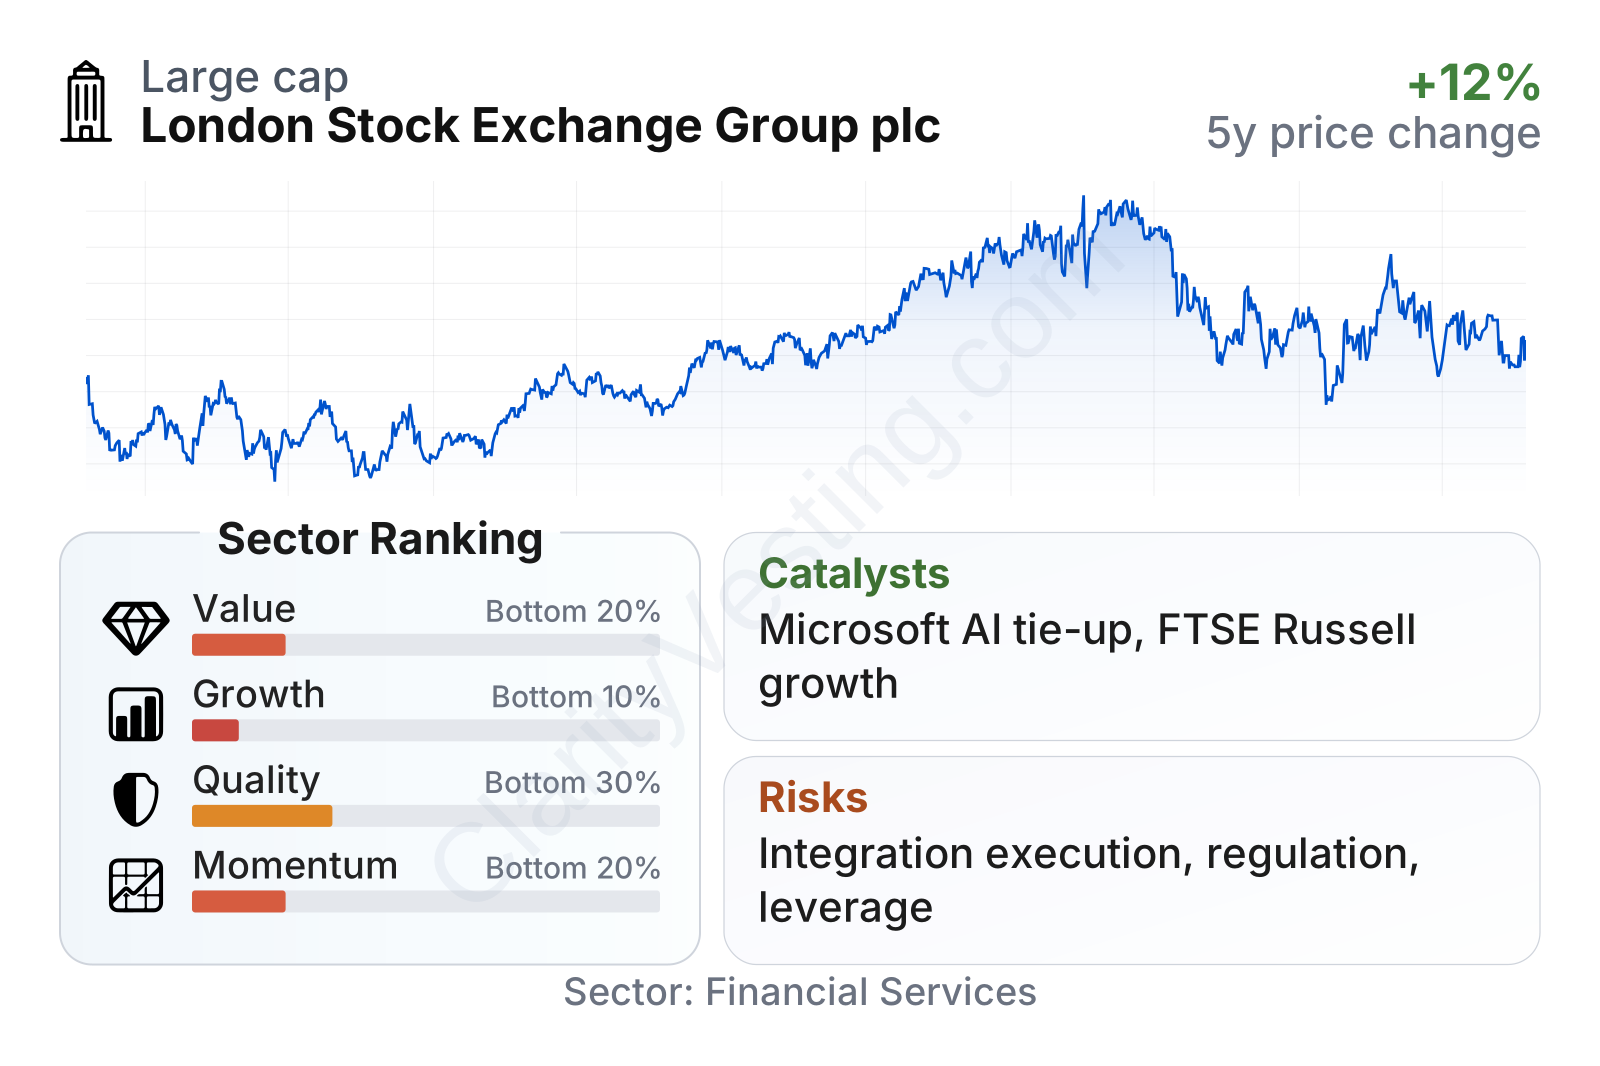
LSEG is a very large company in its sector and its share price has historically moved less than the broader market, reflected in a low beta. The overall factor picture is mixed. On valuation, the shares screen as expensive on earnings and book value versus the sector median, even though free cash flow generation is solid and the PEG ratio looks more moderate. On growth, short-term revenue growth remains positive, but longer-term per-share growth measures are weaker than much of the sector. On quality, margins are respectable and free cash flow is strong, but leverage is higher than the sector median and returns on assets are relatively low. Price momentum has also been soft, with the stock below its longer-term trend and trailing many peers over the last several months.
Growth
LSEG operates in a part of financial services that still has structural growth behind it. Global markets are becoming more electronic, more data-driven, and more dependent on outsourced infrastructure. Institutions increasingly need real-time information, regulatory tools, benchmark products, and post-trade risk management. Those are areas where scale matters and where customers often stay for long periods because switching can be disruptive and costly.
The company’s strategy is coherent with those trends. The Refinitiv acquisition transformed LSEG from a mainly exchange-centered group into a broader data and infrastructure platform. Management has focused on integrating products, simplifying technology, reducing costs, and building stronger links between data, analytics, indexes, execution, and clearing. If that integration continues to work, it can support cross-selling and deeper customer relationships.
One of the most visible growth catalysts is the partnership with Microsoft. That relationship is designed to help LSEG modernize data architecture, improve product development, and use cloud and artificial intelligence tools more broadly across its platforms. For a business that depends on delivering complex information and workflows to large financial institutions, faster product innovation could become a meaningful advantage over time.
Another important catalyst is the expansion of index and analytics activities. FTSE Russell benefits when more assets are benchmarked to its indexes, and that can create a scalable revenue stream with attractive economics. Clearing and risk services also have favorable long-term demand drivers because regulators and market participants continue to prioritize transparency, collateral efficiency, and resilience in financial markets.
Book value per share has moved lower over the last five years, which is not the direction many investors like to see at first glance. In LSEG’s case, that needs to be interpreted carefully because acquisitions, intangible assets, amortization, and capital structure decisions can distort book value for a business built around data, software, and market infrastructure. For this company, cash flow durability and operating execution are usually more informative than book value alone.
Recent company updates have continued to emphasize product launches, customer wins, and progress on the Microsoft-enabled transformation. None of that guarantees faster growth by itself, but it supports the view that LSEG is trying to strengthen the less cyclical, higher-value parts of its portfolio rather than relying mainly on exchange trading activity.
Risks
This article is for informational purposes only and does not constitute financial advice. Some content is AI-generated. See Disclaimer


