Stock Analysis · Landis+Gyr Group AG (LDGYY)
Overview
Landis+Gyr Group AG is a provider of energy management and grid-edge technologies. In simple terms, it sells the equipment and software that help electric, gas, and water utilities measure consumption, connect devices across the network, manage demand, and operate power grids more efficiently. Its best-known products are smart meters, but the business also includes communications systems, software platforms, analytics, and services that support utility billing, network visibility, and grid modernization.
The company generates most of its revenue from utility customers, especially in electricity metering and related infrastructure. Based on its recent annual reporting structure, revenue is primarily split by geography rather than by product line, with the Americas as the largest contributor, followed by Europe, the Middle East and Africa, and then Asia Pacific. A practical way to understand the business is through both lenses:
- Americas: approximately 55% to 65% of revenue. This region includes smart electricity meters, grid communication modules, software, and managed services sold mainly to North American utilities.
- EMEA (Europe, Middle East, Africa): approximately 25% to 35% of revenue. This includes electricity and gas metering, software, and grid solutions, with Europe remaining an important market for replacement cycles and regulatory rollouts.
- Asia Pacific: approximately 5% to 10% of revenue. This business is smaller and more project-driven, with exposure to utility deployments in selected countries.
By activity, smart metering hardware remains the largest revenue engine, while software, services, and grid management solutions are strategically important because they can deepen customer relationships and potentially support more recurring revenue over time.
Over the last several years, revenue expanded materially through fiscal 2024, then moved lower in fiscal 2025 and fiscal 2026, showing how dependent the company can be on project timing, customer ordering patterns, and the pace of utility deployments. Profitability has also been uneven: operating income recovered in fiscal 2026, but net income remained negative, partly reflecting non-operating and special items.
The business mix shows a hardware-heavy model with substantial cost of revenue, while research and development remains meaningful. That combination is typical for a company balancing manufacturing scale with continued spending on connected-grid products and software capabilities.
Key Figures
| Metric | Value | Sector ⓘ |
|---|---|---|
| Date | Oct 17, 2026 | |
| Context | ||
| Sector | Industrials | |
| Industry | Electrical Equipment & Parts | |
| Market Cap ⓘ | $1.51B | |
| Beta ⓘ | 0.77 | |
Value (Cheapness) | ||
| P/E Ratio ⓘ | 39.31 | 22.10 |
| P/B Ratio ⓘ | 1.48 | 1.97 |
| FCF Yield ⓘ | 7.34% | 6.38% |
| Dividend Yield ⓘ | 2.64% | 1.94% |
| EBIT / EV ⓘ | 2.38% | 4.79% |
| PEG ⓘ | N/A | |
Growth (Business expansion) | ||
| Revenue Growth ⓘ | 31.20% | 9.30% |
| RPS Growth (5Y CAGR) ⓘ | -5.47% | 7.81% |
| EPS Growth (5Y CAGR) ⓘ | -35.28% | -13.06% |
| BVPS Growth (5Y CAGR) ⓘ | -5.45% | 6.14% |
| Margin Growth (5Y Trend) ⓘ | 2.41% | 0.88% |
| FCF Growth (5Y CAGR) ⓘ | -9.39% | 11.01% |
| DPS Growth (5Y CAGR) ⓘ | -11.05% | 9.48% |
Quality (Business durability) | ||
| ROIC (Latest) ⓘ | N/A | 10.84% |
| ROA (Latest) ⓘ | -11.59% | 5.41% |
| ROIC (5Y Median) ⓘ | 3.59% | 9.38% |
| ROA (5Y Median) ⓘ | 3.57% | 4.95% |
| Net Debt / EBIT (Latest) ⓘ | 5.56 | 2.08 |
| Net Debt / EBIT (5Y Median) ⓘ | 2.56 | 2.27 |
| Net Debt / EBITDA (Latest) ⓘ | 1.58 | 1.39 |
| Net Debt / Assets ⓘ | 10.44% | 19.28% |
| EBITDA / Interest ⓘ | 3.05 | 9.58 |
| Operating Margin (Latest) ⓘ | 1.50% | 10.50% |
| Operating Margin (5Y Median) ⓘ | 5.62% | 10.29% |
| Debt to Equity (Latest) ⓘ | 42.83% | 65.48% |
| Profit Margin (Latest) ⓘ | -14.48% | 6.67% |
| Free Cash Flow (Latest) ⓘ | $110.61M | |
Momentum (Price trend) | ||
| 3Y Return ⓘ | -26.50% | +61.68% |
| 12M Return (excl. last month) ⓘ | -29.98% | +12.58% |
| 6M Return ⓘ | -17.02% | 0.00% |
| Price vs. 200-Day MA ⓘ | -8.20% | +0.02% |
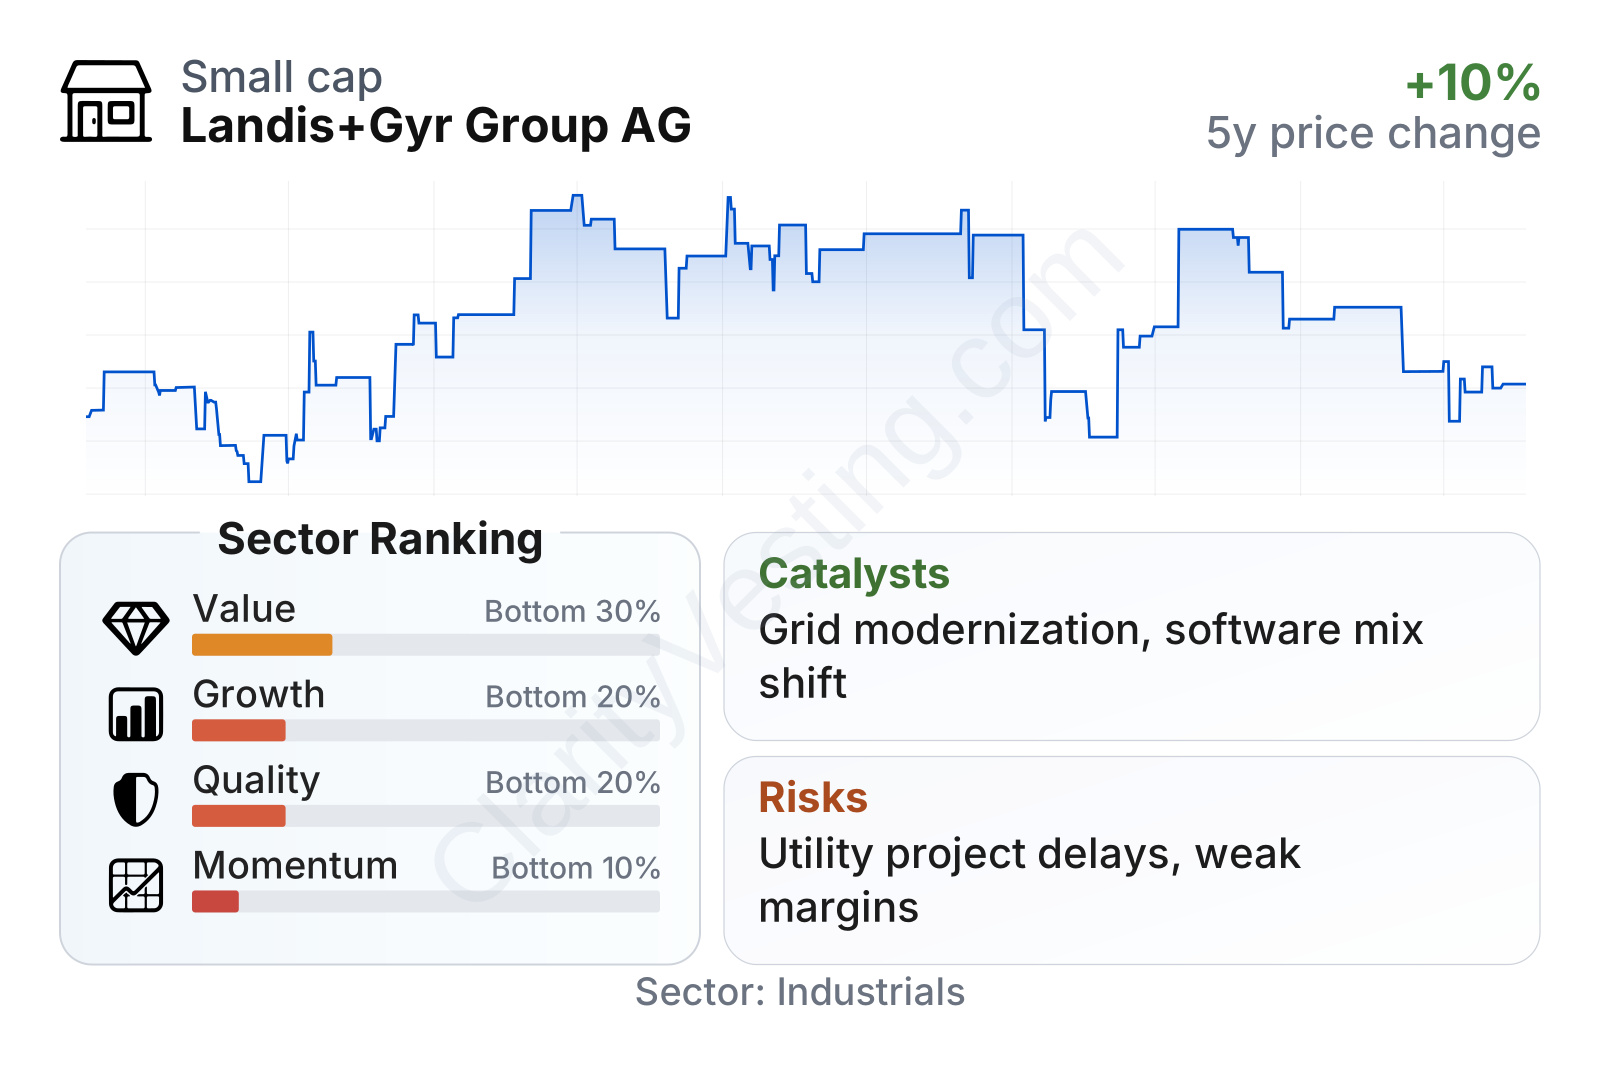
Landis+Gyr currently sits in a mixed position. On valuation-related measures, the shares look stronger than much of the sector on free cash flow yield, dividend yield, and EBIT relative to enterprise value. Balance sheet leverage is also fairly contained, with debt ratios below sector medians. The weaker areas are growth consistency, profitability quality, and share-price momentum. Recent revenue growth has been strong on a year-over-year basis, but the longer five-year picture is much less favorable, with declines in revenue per share, earnings, free cash flow, and book value per share. In other words, the company shows signs of operational resilience in the short run, but not yet a clean long-term compounding profile.
The share-price chart reflects that tension. The stock has been volatile, climbed strongly in 2023, then gave back part of those gains, and has recently traded below its longer-term trend. That pattern usually signals that the market is waiting for firmer proof that margin improvement and order execution can translate into steadier earnings.
Growth
Landis+Gyr operates in a sector with durable long-term demand drivers. Utilities around the world are upgrading aging infrastructure, deploying smart meters, improving grid visibility, integrating distributed energy resources, and responding to regulatory pressure for better efficiency and resilience. Electrification, renewable integration, electric vehicle charging, and demand-side management all increase the need for better data and control at the edge of the grid. That gives the company exposure to a market that should remain relevant well beyond a single upgrade cycle.
Its strategy broadly makes sense in that context. A utility may first purchase metering hardware, then add communication modules, head-end software, analytics, and service contracts. That creates a wider platform relationship than a one-time device sale. The more Landis+Gyr can shift its mix toward software, networking, and service layers, the more it can reduce dependence on pure meter volume and low-margin hardware competition.
A notable catalyst is the multiyear nature of utility procurement. Once a company is selected for a large rollout, revenue can continue over several years and can lead to follow-on software and support work. Another support factor is that utilities are generally cautious customers with long planning horizons, which can make demand less cyclical than in many other industrial niches, even if quarter-to-quarter timing remains lumpy.
Recent corporate updates have also pointed to efforts around portfolio simplification, cost control, and sharpening focus on core grid and metering activities. If those initiatives lead to better execution and more stable margins, they could become more important than headline revenue growth alone. The key opportunity is not just more smart meters sold, but a stronger installed base that can support higher-value digital services over time.
Risks
This article is for informational purposes only and does not constitute financial advice. Some content is AI-generated. See Disclaimer


