Stock Analysis · Lincoln International Inc (LCLN)
Overview
Lincoln International Inc operates in the capital markets part of financial services. The company is best known as an independent advisory firm focused on mergers and acquisitions, capital raising, valuation work, fairness opinions, restructuring advice, and other specialized corporate finance services. In simple terms, it helps companies, private equity firms, lenders, and other institutions complete important transactions and make financial decisions.
Its business model is largely fee-based. Revenue is typically generated when clients hire the firm to advise on a transaction or deliver an opinion, valuation, or related service. That means results can be influenced by the level of deal activity in the broader market, especially mergers, acquisitions, financing transactions, and restructuring assignments.
The most recent annual revenue mix available in the financial flow trends suggests the company’s largest economic source is its advisory and professional services activity, with the remainder absorbed by compensation and operating costs typical for a people-intensive firm. Public filings for this type of business do not always break revenue into highly detailed product percentages, but the core sources can be described as follows:
- M&A and strategic advisory fees — generally the largest source, earned from advising on acquisitions, sales, mergers, and strategic alternatives.
- Capital advisory and financing-related fees — generated from debt advisory, capital raising, and related execution support.
- Valuations and opinions — includes valuation analyses, fairness opinions, and portfolio or dispute-related work.
- Restructuring and special situations — advisory assignments tied to stressed, recapitalization, or turnaround situations.
What stands out financially is the rebound in scale. Revenue moved from roughly $520 million in 2023 to about $580 million in 2024 and then to nearly $784 million in 2025, while net income also improved from about $163 million in 2023 to approximately $214 million in 2025. That pattern points to a business that can recover strongly when transaction markets are more favorable.
The multiyear profit flow shows a cyclical business with meaningful operating leverage. Revenue and gross profit weakened after 2021, then recovered sharply by 2025. Net income also improved, although not as smoothly as revenue, which suggests that compensation and operating expenses can move materially with activity levels.
Key Figures
| Metric | Value | Sector ⓘ |
|---|---|---|
| Date | Oct 03, 2026 | |
| Context | ||
| Sector | Financial Services | |
| Industry | Capital Markets | |
| Market Cap ⓘ | $2.43B | |
| Beta ⓘ | N/A | |
Value (Cheapness) | ||
| P/E Ratio ⓘ | N/A | 12.60 |
| P/B Ratio ⓘ | 52.10 | 1.23 |
| FCF Yield ⓘ | 7.28% | 10.16% |
| Dividend Yield ⓘ | N/A | 2.96% |
| EBIT / EV ⓘ | 4.31% | 7.77% |
| PEG ⓘ | N/A | |
Growth (Business expansion) | ||
| Revenue Growth ⓘ | 50.80% | 9.50% |
| RPS Growth (5Y CAGR) ⓘ | -21.50% | 12.10% |
| EPS Growth (5Y CAGR) ⓘ | N/A | -9.45% |
| BVPS Growth (5Y CAGR) ⓘ | N/A | 5.01% |
| Margin Growth (5Y Trend) ⓘ | -25.67% | -4.07% |
| FCF Growth (5Y CAGR) ⓘ | -12.02% | 4.96% |
| DPS Growth (5Y CAGR) ⓘ | N/A | 8.79% |
Quality (Business durability) | ||
| ROIC (Latest) ⓘ | N/A | 9.60% |
| ROE (Latest) ⓘ | N/A | 13.84% |
| ROA (Latest) ⓘ | N/A | 1.53% |
| ROIC (5Y Median) ⓘ | N/A | 7.86% |
| ROE (5Y Median) ⓘ | N/A | 12.20% |
| ROA (5Y Median) ⓘ | 25.96% | 1.29% |
| Net Debt / EBIT (Latest) ⓘ | -0.25 | 0.91 |
| Net Debt / EBIT (5Y Median) ⓘ | -0.41 | 0.74 |
| Net Debt / EBITDA (Latest) ⓘ | -0.09 | 0.97 |
| Operating Margin (Latest) ⓘ | 5.35% | 22.12% |
| Operating Margin (5Y Median) ⓘ | 29.86% | 24.39% |
| Debt to Equity (Latest) ⓘ | 134.73% | 60.37% |
| Profit Margin (Latest) ⓘ | 17.87% | 26.62% |
| Free Cash Flow (Latest) ⓘ | $176.85M | |
Momentum (Price trend) | ||
| 3Y Return ⓘ | N/A | +89.23% |
| 12M Return (excl. last month) ⓘ | N/A | +17.35% |
| 6M Return ⓘ | N/A | +10.00% |
| Price vs. 200-Day MA ⓘ | N/A | +3.73% |
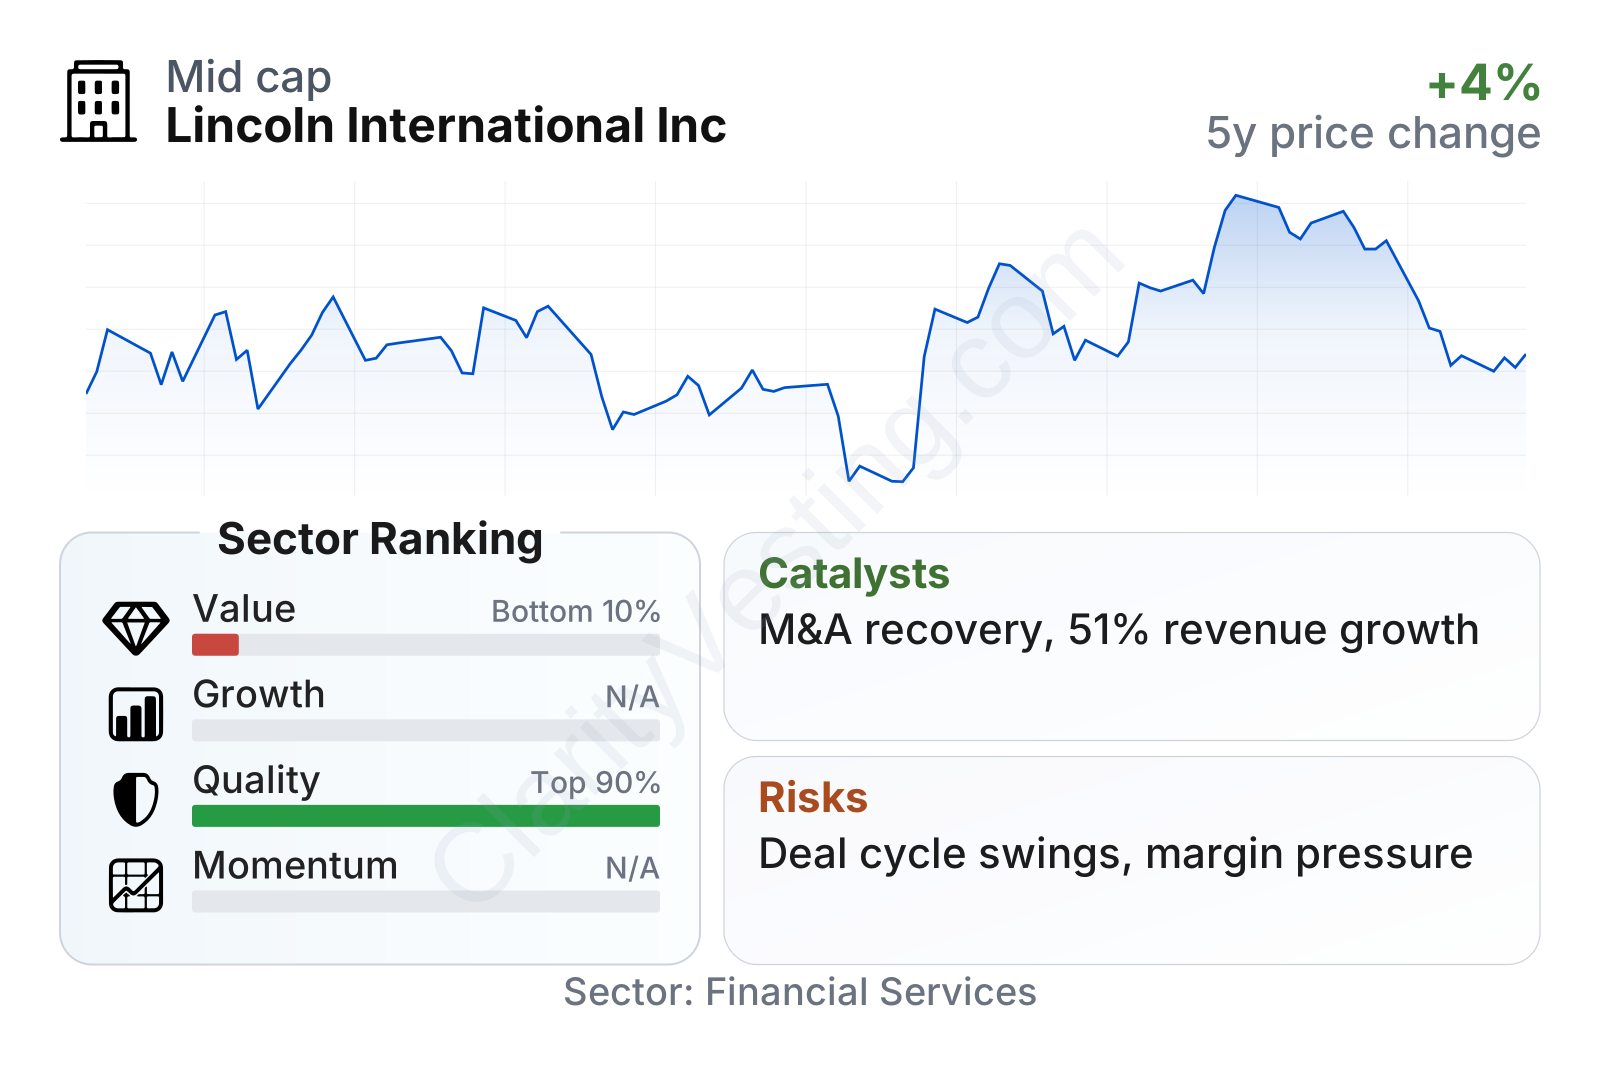
Lincoln International is a mid-sized public company in its sector. The factor profile is unusual: quality ranks very strong versus peers, while value ranks near the bottom of the sector. In practical terms, the market is attaching a rich valuation to a business that has a solid balance-sheet position and good returns history, but weaker near-term margin characteristics than many financial peers.
Cash generation remains meaningful, with trailing free cash flow around $177 million, and the company’s net debt measures are negative, which indicates more cash than debt on those ratios. That is an important stabilizer for a cyclical advisory business. At the same time, current operating margin is only about 5%, well below the sector median near 23%, and profit margin is also below the median. So the financial picture is not weak, but it is mixed: strong balance-sheet flexibility and profitability on some measures, paired with thinner current operating economics than many peers.
Growth
The company operates in a sector that tends to grow over time with corporate activity, private equity turnover, credit formation, and cross-border dealmaking. Over the long run, demand for independent advice can expand as transactions become more complex and boards seek conflict-free opinions. That said, this is not a straight-line growth market. Advisory revenue usually rises and falls with confidence, interest rates, financing conditions, and equity market health.
Lincoln International’s recent strategy appears sensible for future growth because it is centered on specialized advice rather than balance-sheet-heavy risk taking. That can support expansion without requiring the firm to commit large amounts of capital in the way a lender or principal investor would. If mergers and acquisitions, sponsor-backed exits, and financing activity continue to normalize, the firm has a direct way to participate.
A major near-term positive is the very strong year-over-year revenue growth shown in the latest metrics, around 51%, far ahead of the sector median near 10%. That suggests the company has been benefiting from a rebound in client activity or an increase in completed mandates. However, the longer record is less smooth: revenue per share, free cash flow, and operating margin trends over five years have been weaker than many peers, which means recent acceleration still needs to prove it can last across a full cycle.
The earnings trend shown here looks stable in the most recent periods displayed, which can be read as a sign that profitability has at least stopped deteriorating in the short run. For a transaction-driven advisory firm, stability matters because earnings can swing quickly when markets slow.
Book value per share has improved significantly since 2021, moving from negative territory to clearly positive levels by 2024 and 2025. That change supports the view that the company’s capital base has strengthened, even if book value is not always the best standalone yardstick for an advisory firm whose real assets are relationships, reputation, and talent.
The strongest catalyst is likely a broader reopening of M&A and financing markets. If lower financing friction, stronger equity markets, or rising sponsor activity lead to more closings, firms like Lincoln International typically benefit disproportionately because a large part of revenue is tied to successful transaction completion. The sharp jump in 2025 revenue already hints that this operating leverage can be powerful when conditions improve.
Risks
This article is for informational purposes only and does not constitute financial advice. Some content is AI-generated. See Disclaimer


