Stock Analysis · LB Pharmaceuticals Inc (LBRX)
Overview
LB Pharmaceuticals Inc is a clinical-stage biotechnology company. In simple terms, it is developing drug candidates rather than selling established medicines at scale. The company’s focus has been on treatments for serious psychiatric and central nervous system conditions, which places it in a part of healthcare where the medical need is high but development risk is also high.
At this stage, the business is not operating like a traditional pharmaceutical company with recurring product sales. Its economic value is tied mainly to the progress of its research pipeline, clinical trial results, regulatory milestones, and its ability to raise capital or sign partnerships.
The company’s revenue mix is currently very limited.
- Product revenue and commercial sales: approximately 0% in recent annual reporting periods, meaning the company is not yet generating meaningful revenue from marketed products.
- Other revenue sources: no material recurring revenue stream is clearly established in recent annual figures.
That makes LB Pharmaceuticals closer to a development platform than a cash-generating operating business. The main financial outflows are research and development spending, which supports clinical programs, and general administrative expenses, which cover corporate operations.
Its cost structure also shows the classic profile of an early-stage biotech: heavy spending before any material commercialization. Research and development rose sharply in 2024 before easing in 2025, while selling, general, and administrative expenses stayed meaningful. Net losses remained substantial throughout the period, although the loss narrowed in 2025 compared with 2024.
The overall pattern is straightforward: little to no revenue, significant operating expenses, and value creation dependent on turning scientific progress into future approvals or licensing opportunities.
Key Figures
| Metric | Value | Sector ⓘ |
|---|---|---|
| Date | Oct 17, 2026 | |
| Context | ||
| Sector | Healthcare | |
| Industry | Biotechnology | |
| Market Cap ⓘ | $1.10B | |
| Beta ⓘ | N/A | |
Value (Cheapness) | ||
| P/E Ratio ⓘ | 340.00 | 24.79 |
| P/B Ratio ⓘ | 3.33 | 3.08 |
| FCF Yield ⓘ | -7.55% | 3.15% |
| Dividend Yield ⓘ | N/A | 1.94% |
| EBIT / EV ⓘ | -8.34% | 0.57% |
| PEG ⓘ | N/A | |
Growth (Business expansion) | ||
| Revenue Growth ⓘ | N/A | 7.45% |
| RPS Growth (5Y CAGR) ⓘ | N/A | 8.61% |
| EPS Growth (5Y CAGR) ⓘ | N/A | -17.81% |
| BVPS Growth (5Y CAGR) ⓘ | N/A | 3.72% |
| Margin Growth (5Y Trend) ⓘ | N/A | -0.62% |
| FCF Growth (5Y CAGR) ⓘ | N/A | 1.04% |
| DPS Growth (5Y CAGR) ⓘ | N/A | 6.77% |
Quality (Business durability) | ||
| ROIC (Latest) ⓘ | -20.76% | 3.24% |
| ROA (Latest) ⓘ | -25.11% | 3.01% |
| ROIC (5Y Median) ⓘ | N/A | 4.60% |
| ROA (5Y Median) ⓘ | -18.69% | 1.89% |
| Net Debt / EBIT (Latest) ⓘ | N/A | 1.34 |
| Net Debt / EBIT (5Y Median) ⓘ | N/A | 1.84 |
| Net Debt / EBITDA (Latest) ⓘ | N/A | 1.00 |
| Net Debt / Assets ⓘ | -76.83% | 5.45% |
| EBITDA / Interest ⓘ | N/A | 9.64 |
| Operating Margin (Latest) ⓘ | N/A | 9.27% |
| Operating Margin (5Y Median) ⓘ | N/A | 7.38% |
| Debt to Equity (Latest) ⓘ | 1.57% | 28.58% |
| Profit Margin (Latest) ⓘ | N/A | 3.59% |
| Free Cash Flow (Latest) ⓘ | -$82.83M | |
Momentum (Price trend) | ||
| 3Y Return ⓘ | N/A | +42.80% |
| 12M Return (excl. last month) ⓘ | +157.57% | +18.50% |
| 6M Return ⓘ | +26.00% | +7.57% |
| Price vs. 200-Day MA ⓘ | +16.33% | +5.12% |
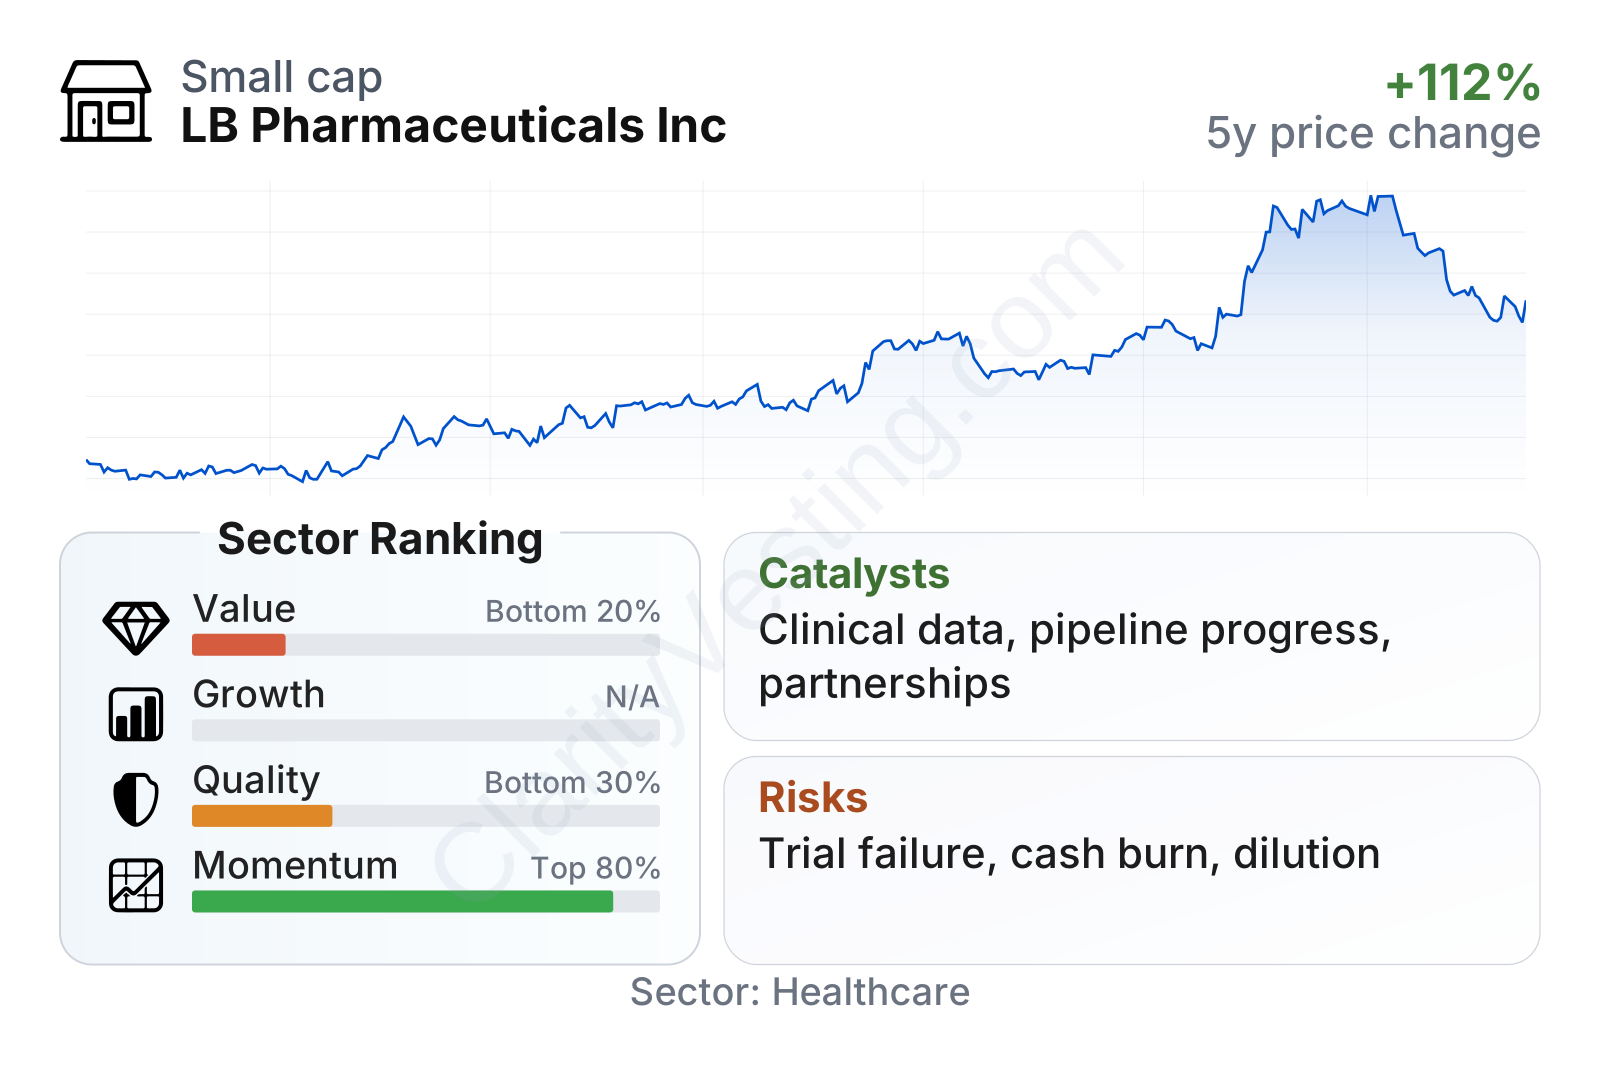
The key metrics paint a mixed picture that is typical for a pre-revenue biotech. Valuation measures rank in the lower end of the healthcare sector, but that is largely because common earnings-based ratios are not very useful when a company has no meaningful revenue and negative cash flow. Profitability and return metrics are weak versus sector norms, reflecting ongoing losses and the fact that capital is being consumed to fund development rather than producing current returns.
One notable strength is the balance sheet structure. Debt is very low, well below the sector median, and net debt is negative relative to assets, which indicates the company has more cash than debt. That lowers financial strain compared with highly leveraged biotech peers. At the same time, free cash flow remains negative, so the company still depends on existing cash reserves and potentially future fundraising.
Market behavior has been much stronger than the sector median in recent months. The share price has risen sharply over the last year and stands well above its long-term average trend, suggesting that expectations around the pipeline have improved meaningfully. For long-term analysis, that matters because a stronger stock can make future capital raising less painful, but it also means more optimism may already be reflected in the price.
Growth
LB Pharmaceuticals operates in biotechnology, and more specifically in drug development for mental health and central nervous system disorders. This remains an attractive area for long-term industry growth because psychiatric diseases are widespread, existing treatments often leave large unmet needs, and successful drugs in this field can address large patient populations. In addition, regulators and healthcare systems continue to show interest in better therapies for severe psychiatric conditions.
The company’s strategy makes sense within that setting: focus resources on advancing lead assets through clinical development, generate proof-of-concept data, and create optionality for future partnerships, larger trials, or eventual commercialization. For a company without a marketed product, the most important growth drivers are not current sales trends but milestone events. Positive clinical data, progress into later-stage studies, regulatory feedback, or a collaboration with a larger drugmaker could all reshape its outlook quickly.
A strong near-term catalyst is any evidence that the lead program can show both efficacy and tolerability in patient studies. In biotech, one strong study can change the commercial potential of a company much faster than years of ordinary business execution in other industries. If LB Pharmaceuticals can demonstrate differentiated results in a difficult treatment area, it could move from being viewed as a speculative research company to a more credible future product company.
Another supportive point is that the company appears to have reduced its annual loss from the 2024 peak while maintaining a low-debt balance sheet. That does not solve the funding question, but it gives management more flexibility to plan the next development steps around scientific milestones rather than debt service.
Risks
This article is for informational purposes only and does not constitute financial advice. Some content is AI-generated. See Disclaimer


