Stock Analysis · Liberty Energy Inc (LBRT)
Overview
Liberty Energy is a U.S. oilfield services company focused mainly on hydraulic fracturing and related completion services for oil and natural gas wells. In simple terms, it helps exploration and production companies finish wells so hydrocarbons can flow commercially. Its activity is concentrated in North America, especially major shale basins, and its business rises and falls with drilling and completion demand from upstream producers.
The company’s revenue is driven primarily by service activity, equipment utilization, and pricing in pressure pumping. Based on recent company filings, the business is still largely centered on completion services, with a smaller but growing contribution from adjacent offerings such as wireline, power solutions, logistics, and technology-enabled services. Liberty also has exposure to newer energy and industrial opportunities through its power and data-related initiatives, but these are not yet the core earnings engine.
The main revenue sources can be summarized this way:
- Hydraulic fracturing and completion services: approximately 75% to 85% of revenue. This includes pumping fleets, proppant handling, fluid systems, and field execution used to stimulate shale wells.
- Sand, logistics, wireline, and other wellsite services: approximately 10% to 20%. These activities support the completion process and help Liberty offer a more integrated package to customers.
- Power, technology, and emerging energy-related solutions: likely less than 10% at present. This includes lower-emission equipment, distributed power initiatives, and newer infrastructure opportunities that management has been developing.
One important business characteristic is that Liberty’s cost structure is closely tied to field activity. When demand is strong, margins can expand quickly because expensive equipment is used more efficiently. When customers slow completions, profits can compress just as quickly. Over the last several years, the company moved from losses in 2021 to very strong profitability in 2022 and 2023, then back to a more muted earnings profile in 2024 and 2025 as the service cycle cooled.
The operating picture shows that revenue stayed large through 2025, but profitability narrowed materially from the 2023 peak. Gross profit, operating income, and net income all fell from cycle highs, which underlines how sensitive Liberty remains to pricing and utilization in pressure pumping.
Key Figures
| Metric | Value | Sector ⓘ |
|---|---|---|
| Date | Oct 17, 2026 | |
| Context | ||
| Sector | Energy | |
| Industry | Oil & Gas Equipment & Services | |
| Market Cap ⓘ | $3.12B | |
| Beta ⓘ | 0.72 | |
Value (Cheapness) | ||
| P/E Ratio ⓘ | 25.82 | 15.44 |
| P/B Ratio ⓘ | 1.54 | 1.73 |
| FCF Yield ⓘ | -10.15% | 8.20% |
| Dividend Yield ⓘ | 1.84% | 3.59% |
| EBIT / EV ⓘ | 3.59% | 7.46% |
| PEG ⓘ | N/A | |
Growth (Business expansion) | ||
| Revenue Growth ⓘ | 14.00% | 26.90% |
| RPS Growth (5Y CAGR) ⓘ | 14.18% | 6.90% |
| EPS Growth (5Y CAGR) ⓘ | -53.33% | -15.73% |
| BVPS Growth (5Y CAGR) ⓘ | 16.18% | 6.07% |
| Margin Growth (5Y Trend) ⓘ | 12.44% | 0.58% |
| FCF Growth (5Y CAGR) ⓘ | N/A | 1.86% |
| DPS Growth (5Y CAGR) ⓘ | 329.37% | 16.79% |
Quality (Business durability) | ||
| ROIC (Latest) ⓘ | 4.01% | 11.40% |
| ROA (Latest) ⓘ | 3.06% | 6.06% |
| ROIC (5Y Median) ⓘ | 16.46% | 10.30% |
| ROA (5Y Median) ⓘ | 9.98% | 5.42% |
| Net Debt / EBIT (Latest) ⓘ | 7.29 | 1.64 |
| Net Debt / EBIT (5Y Median) ⓘ | 0.95 | 1.83 |
| Net Debt / EBITDA (Latest) ⓘ | 1.72 | 1.08 |
| Net Debt / Assets ⓘ | 23.57% | 17.29% |
| EBITDA / Interest ⓘ | 19.46 | 9.64 |
| Operating Margin (Latest) ⓘ | 3.46% | 16.27% |
| Operating Margin (5Y Median) ⓘ | 10.10% | 20.39% |
| Debt to Equity (Latest) ⓘ | 82.14% | 54.76% |
| Profit Margin (Latest) ⓘ | 2.92% | 8.82% |
| Free Cash Flow (Latest) ⓘ | -$316.58M | |
Momentum (Price trend) | ||
| 3Y Return ⓘ | +0.61% | +67.38% |
| 12M Return (excl. last month) ⓘ | +85.51% | +49.19% |
| 6M Return ⓘ | -33.36% | +7.07% |
| Price vs. 200-Day MA ⓘ | -27.15% | +9.56% |
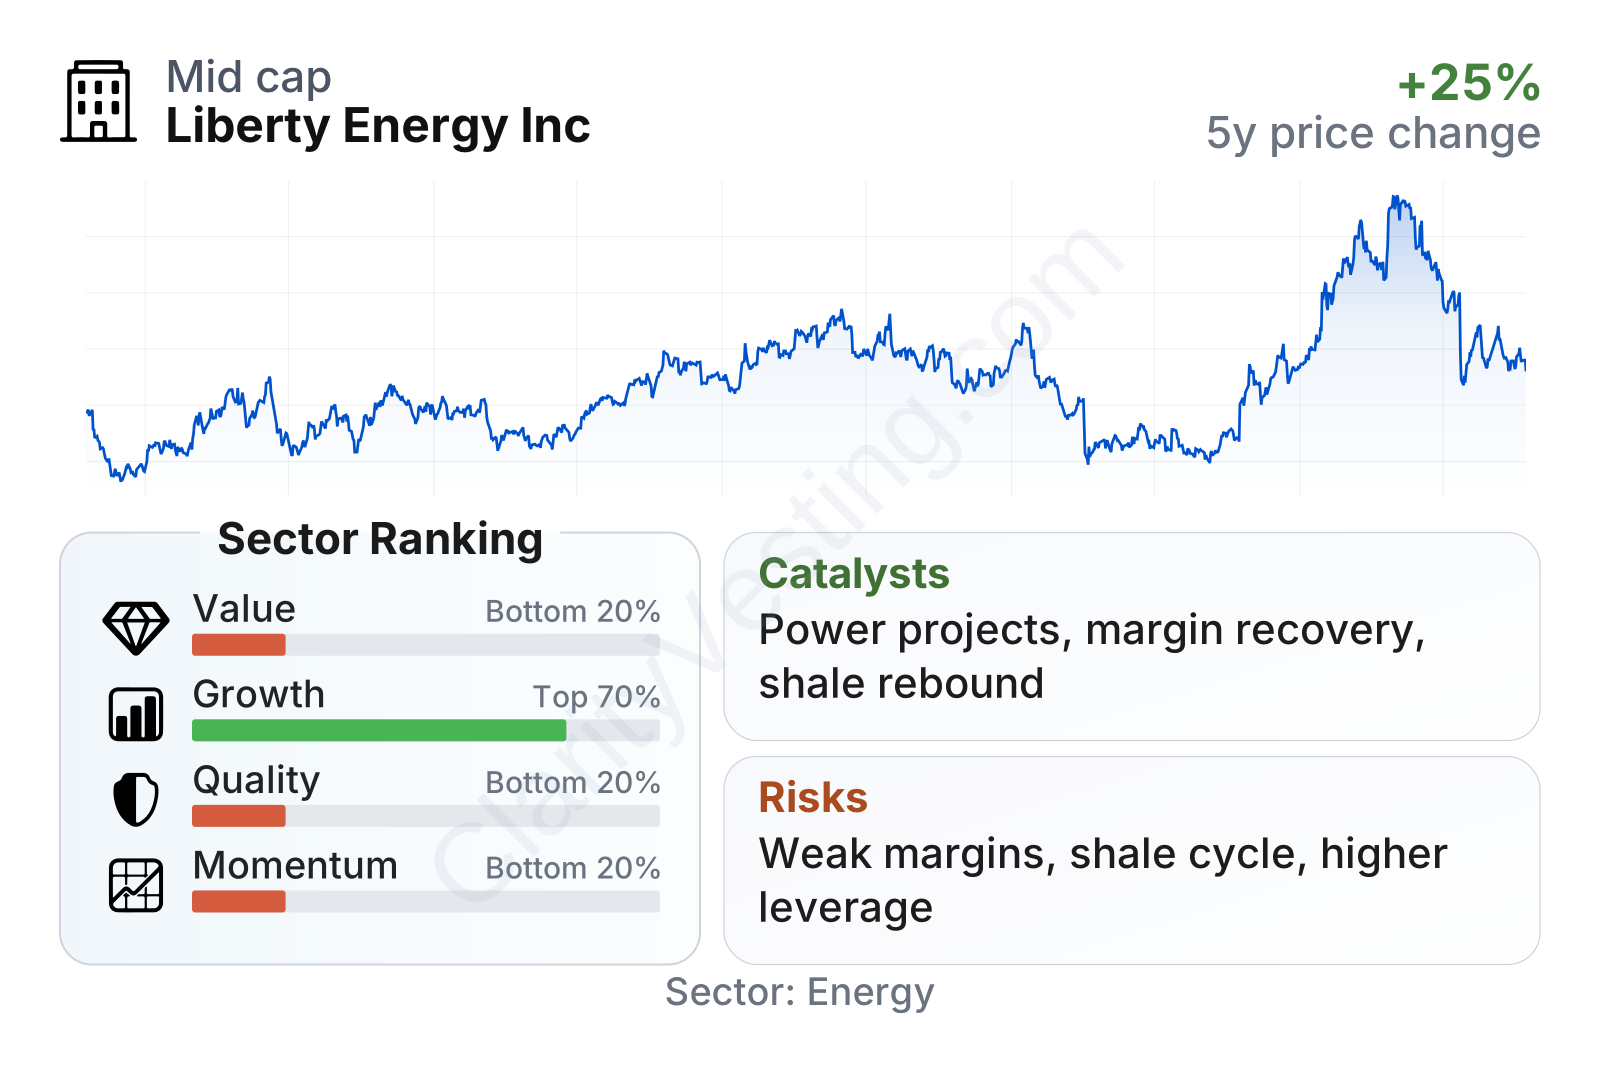
Liberty is a mid-sized energy services company with a stock that has been volatile but not unusually high-beta compared with many energy names. The metrics table points to a mixed profile: growth indicators are still respectable over multi-year periods, but current quality, cash generation, and valuation measures look weaker than much of the sector. In particular, recent free cash flow has turned negative and returns on capital are below industry medians, while the earnings multiple sits above the sector median.
The share price path also reflects this cyclicality. The stock recovered strongly from earlier lows, sold off sharply during the 2025 downturn, and then rebounded again into 2026. That pattern fits a company whose results are driven less by slow, steady compounding and more by swings in oilfield activity and investor expectations for the next service cycle.
Growth
Liberty operates in a sector that is mature rather than structurally high-growth, but it can still grow meaningfully when North American shale activity improves, when it takes market share, or when it expands into adjacent services. Oil and gas producers continue to rely on high-intensity completions to maintain production, so pressure pumping remains essential infrastructure for the shale industry even if overall demand moves in cycles.
Management’s strategy has generally made sense for future growth because it tries to move Liberty beyond being only a commodity service provider. The company has been investing in integrated wellsite offerings, digital capabilities, lower-emission fleet upgrades, and power-related businesses. That matters because pure pressure pumping often faces pricing pressure, while broader service bundles and technology-enabled offerings can deepen customer relationships and improve differentiation.
Recent revenue trends suggest the company may be coming off a softer patch rather than entering a major contraction. Growth was extremely strong in 2022, slowed through 2023 and 2024, turned negative for a period, and then returned to positive territory by late 2025 and into 2026. That is not the pattern of a straight-line grower, but it does indicate that demand has stabilized enough for year-over-year comparisons to improve again.
Cash generation is a more cautious signal. Free cash flow was solid in 2023 and 2024, then weakened sharply and turned negative more recently. For a capital-intensive service company, that can happen when equipment spending rises, working capital swings unfavorably, or margins compress. For long-term analysis, the key question is whether the recent cash outflow is a temporary investment phase tied to positioning for future demand or a sign that the economics of the cycle are becoming less attractive.
A potentially important catalyst is Liberty’s push into power and data infrastructure themes through distributed energy and natural gas power solutions. If these efforts scale, they could give the company exposure to demand linked to electrification, grid constraints, and data center power needs rather than relying only on traditional completions activity. That opportunity is still emerging, but it broadens the strategic runway beyond core fracturing.
Recent company communications have also emphasized efficiency, technology, and next-generation fleet design. Those initiatives do not remove cyclicality, but they can help Liberty win business with large operators that want reliability, emissions improvements, and integrated execution across the wellsite.
Risks
This article is for informational purposes only and does not constitute financial advice. Some content is AI-generated. See Disclaimer


