Stock Analysis · Ladder Capital Corp (LADR)
Overview
Ladder Capital Corp is a commercial real estate finance company organized as a REIT. In simple terms, it makes money by lending against commercial properties, owning certain real estate investments, and holding a portfolio of securities tied to real estate debt. Its focus is primarily on the U.S. commercial property market, and the company emphasizes senior secured lending, which means it often sits higher in the repayment order than riskier forms of property financing.
The business is built around three main operating segments. Based on recent company reporting, revenue and earnings can shift meaningfully from year to year because property sales, securitizations, interest rates, and loan repayments can change the mix. Still, the core sources are clear:
- Lending segment: approximately 50% to 65% of recent revenue, depending on the period. This includes interest income from first mortgage loans, conduit loans, and other senior secured commercial real estate debt.
- Securities segment: approximately 20% to 30% of recent revenue. This generally includes income from commercial mortgage-backed securities and other real estate-related investment securities.
- Real estate segment: approximately 10% to 25% of recent revenue. This includes owning and operating commercial properties as well as gains from property sales when transactions occur.
Ladder’s model is designed to be more diversified than a pure mortgage lender. That matters because different parts of commercial real estate do not always perform the same way at the same time. In stronger lending markets, loan originations and interest income can lead. In other periods, property sales, securitizations, or securities investments may play a larger role.
Over the last several years, total revenue rose sharply in 2022, then softened through 2023, 2024, and 2025. Profitability remained positive, but earnings have become less robust as revenue cooled. Interest expense also remains a major part of the cost structure, which is normal for a leveraged real estate finance business but still important when rates stay elevated.
The broad picture is a company that still produces healthy operating margins, but with more pressure on net income than a few years ago as commercial real estate financing conditions have become less favorable.
Key Figures
| Metric | Value | Sector ⓘ |
|---|---|---|
| Date | Oct 17, 2026 | |
| Context | ||
| Sector | Real Estate | |
| Industry | REIT - Mortgage | |
| Market Cap ⓘ | $1.09B | |
| Beta ⓘ | 1.03 | |
Value (Cheapness) | ||
| P/E Ratio ⓘ | 21.05 | 17.38 |
| P/B Ratio ⓘ | 0.77 | 0.85 |
| FCF Yield ⓘ | 9.41% | 7.38% |
| Dividend Yield ⓘ | 10.53% | 4.85% |
| EBIT / EV ⓘ | 3.17% | 3.78% |
| PEG ⓘ | 1.89 | |
Growth (Business expansion) | ||
| Revenue Growth ⓘ | 2.20% | 5.30% |
| RPS Growth (5Y CAGR) ⓘ | 1.97% | 6.02% |
| EPS Growth (5Y CAGR) ⓘ | -23.44% | -11.37% |
| BVPS Growth (5Y CAGR) ⓘ | -0.56% | 0.45% |
| Margin Growth (5Y Trend) ⓘ | -5.50% | -0.22% |
| FCF Growth (5Y CAGR) ⓘ | 2.21% | 5.40% |
| DPS Growth (5Y CAGR) ⓘ | 3.61% | 5.02% |
Quality (Business durability) | ||
| ROIC (Latest) ⓘ | 3.45% | 5.69% |
| ROE (Latest) ⓘ | 3.57% | 7.56% |
| ROA (Latest) ⓘ | 1.02% | 2.85% |
| ROIC (5Y Median) ⓘ | 6.18% | 4.22% |
| ROE (5Y Median) ⓘ | 6.59% | 6.03% |
| ROA (5Y Median) ⓘ | 1.76% | 2.44% |
| Net Debt / EBIT (Latest) ⓘ | 24.66 | 7.59 |
| Net Debt / EBIT (5Y Median) ⓘ | 9.94 | 8.40 |
| Net Debt / EBITDA (Latest) ⓘ | 20.35 | 5.27 |
| Net Debt / Assets ⓘ | 70.77% | 37.76% |
| EBITDA / Interest ⓘ | 0.99 | 4.10 |
| Operating Margin (Latest) ⓘ | 42.31% | 35.29% |
| Operating Margin (5Y Median) ⓘ | 66.63% | 37.31% |
| Debt to Equity (Latest) ⓘ | 280.19% | 88.87% |
| Profit Margin (Latest) ⓘ | 24.03% | 19.61% |
| Free Cash Flow (Latest) ⓘ | $102.98M | |
Momentum (Price trend) | ||
| 3Y Return ⓘ | +14.33% | +30.75% |
| 12M Return (excl. last month) ⓘ | -8.93% | +4.36% |
| 6M Return ⓘ | -10.54% | -2.52% |
| Price vs. 200-Day MA ⓘ | -8.04% | -2.34% |
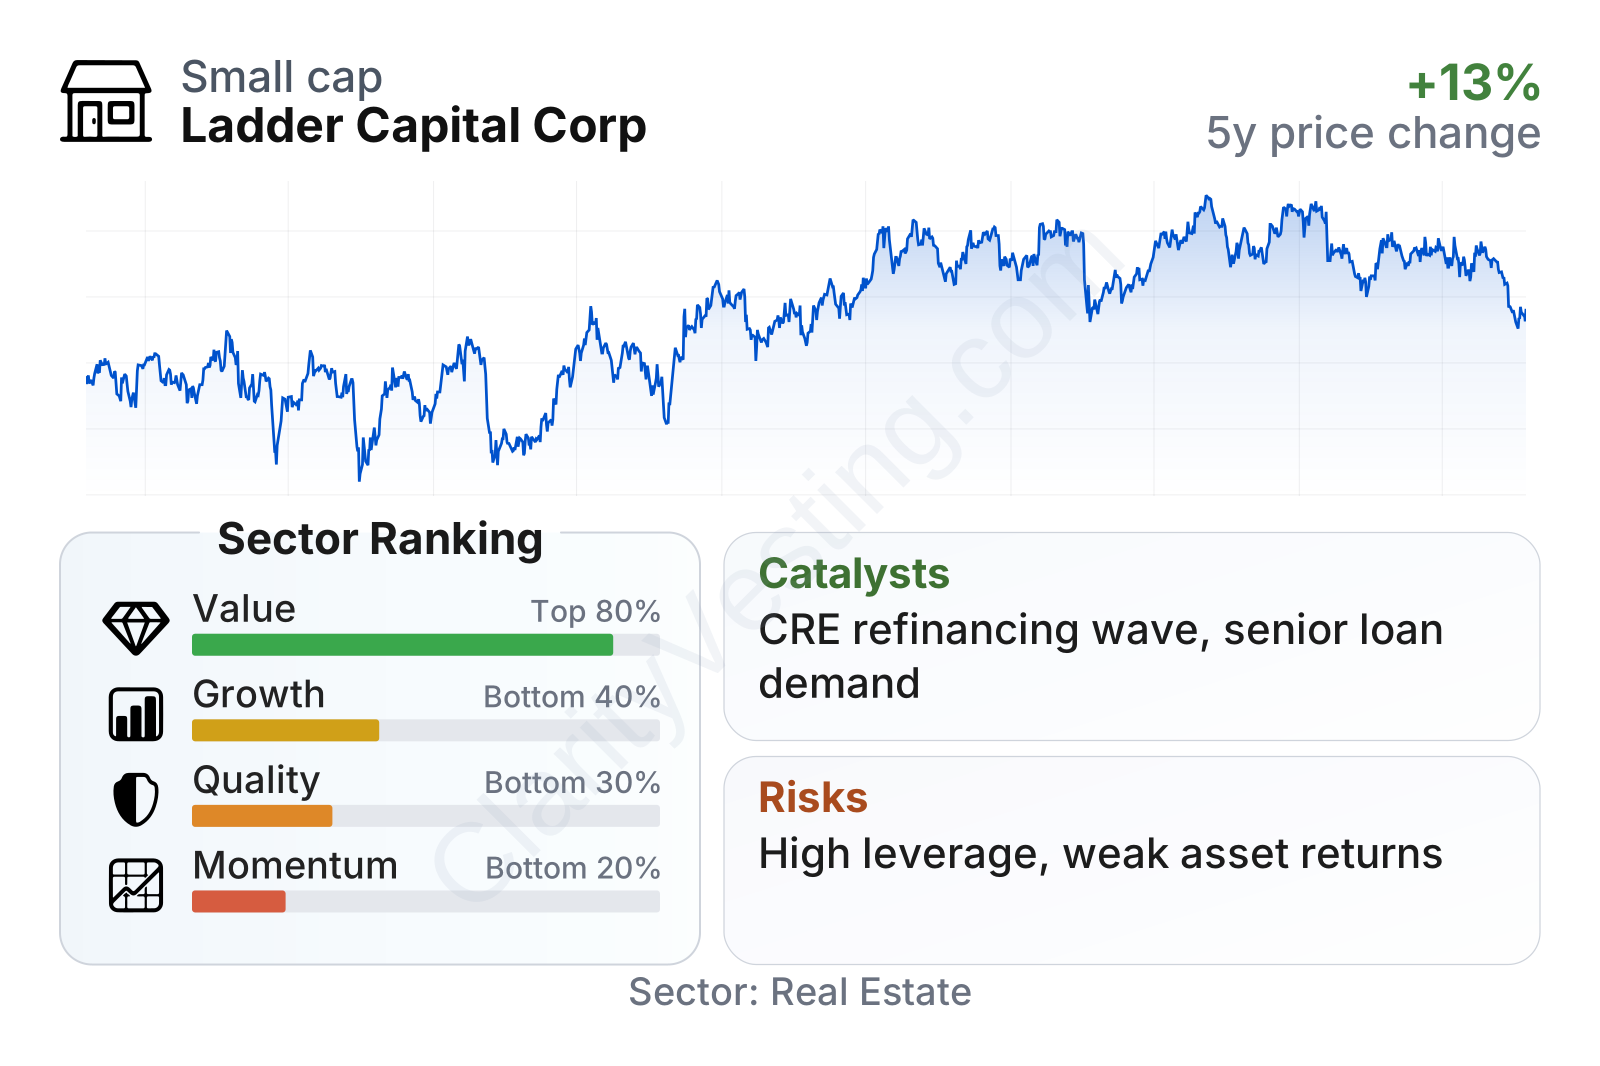
Ladder Capital is a small-cap real estate finance company with share-price volatility close to the broader market. The overall factor mix is uneven. Value metrics look mixed rather than outright cheap or expensive: the price-to-book ratio is below the sector median, the free cash flow yield is stronger than typical peers, and the dividend yield is unusually high, but the earnings multiple is somewhat above the sector median. Growth, quality, and momentum all rank below much of the sector, with weaker recent returns, slower revenue expansion, lower asset profitability, and much heavier leverage than many peers.
The stock price has been relatively range-bound over the last several years, with a recovery from 2022 lows but limited sustained upward momentum. That fits the company’s current profile: solid cash generation and income distribution, but weaker operating trends than the stronger names in the group.
Growth
Ladder operates in a sector that should remain relevant over the long term because commercial real estate always needs financing, refinancing, and restructuring. In the current environment, that need may actually be increasing. Many property owners face loan maturities at borrowing costs far above what they enjoyed several years ago. A lender with experience, liquidity, and underwriting discipline can find attractive opportunities when banks pull back or become more selective.
The company’s strategy makes sense in that context. Ladder has long emphasized senior secured loans, internally managed operations, and a mix of lending, securities, and owned real estate. That structure can help it stay active when one part of the market slows. The commercial real estate credit market has also been reshaped by tighter bank regulation and more cautious balance-sheet usage by traditional lenders, which can open room for non-bank capital providers.
That said, the recent growth profile is not especially strong. Revenue per share improved materially in 2022 but has trended lower since then. The latest five-year annualized pace is positive, but it trails the sector median by a wide margin. This suggests that Ladder is participating in the market opportunity, but not converting it into sustained top-line expansion as effectively as stronger peers.
The dividend record is steadier. Dividend per share has generally moved upward over the last five years, with only modest slippage more recently. Combined with a trailing yield near 10%, this remains one of the company’s most visible attractions. For a REIT, a stable payout can signal that management still sees recurring cash generation, even when reported earnings fluctuate.
One of the clearest catalysts is the refinancing wave building across commercial real estate. If elevated interest rates continue to pressure property owners and banks stay selective, private and non-bank lenders such as Ladder may see more opportunities to originate loans on terms that are more favorable than in the ultra-low-rate era. Another potential tailwind is any improvement in capital markets activity, because securitization and asset sales can help recycle capital and support new lending.
Recent company communications have also continued to highlight liquidity, a focus on senior loans, and a conservative underwriting posture. In a market where distress can create opportunity, that positioning may help preserve optionality for future deployment.
Risks
This article is for informational purposes only and does not constitute financial advice. Some content is AI-generated. See Disclaimer


