Stock Analysis · Karman Holdings Inc (KRMN)
Overview
Karman Holdings Inc operates in the aerospace and defense industry. The company focuses on highly engineered systems and components used in demanding environments, particularly space and missile-related applications. In practical terms, it sells specialized hardware and subsystems that need to perform reliably under extreme heat, pressure, and mission-critical conditions. That makes Karman part of a niche area of defense manufacturing where technical know-how, certifications, and customer relationships matter a great deal.
Based on the company’s recent public filings, revenue is primarily tied to defense and space programs rather than broad commercial aviation. The business appears to be driven by a mix of propulsion-related systems, protection and survival materials, and other engineered components integrated into larger customer platforms. Precise segment percentages are not clearly broken out in the public material available here, so the clearest way to describe the business is by end market and product role rather than exact line-item shares.
The business model is attractive in one important way: once a supplier is selected for a defense or space platform, that position can remain in place for years because customers are reluctant to switch proven parts in critical systems. At the same time, this also means results can be influenced by program timing, contract awards, and production schedules.
- Defense and missile-related systems: engineered components and subsystems used in missile, strategic defense, and related national security programs.
- Space and launch applications: products used in launch vehicles, spacecraft, and other space systems where weight, heat resistance, and reliability are essential.
- Specialized materials and structures: protective and high-performance materials, structures, and assemblies integrated into customer platforms.
Over the last several years, the company’s revenue expanded from about $226 million in 2022 to about $472 million in 2025. Gross profit and operating income also moved higher over that period, showing that growth has not come only from volume, but also from a business mix capable of producing solid operating margins. One visible limitation is that interest expense has remained high, which has reduced the conversion of operating profit into net income.
The long-term trend is clearly upward: sales and gross profit have risen strongly since 2022, while operating income has also improved. The main drag has been financing costs, which have stayed elevated enough to keep net earnings much smaller than operating profit.
Key Figures
| Metric | Value | Sector ⓘ |
|---|---|---|
| Date | Oct 24, 2026 | |
| Context | ||
| Sector | Industrials | |
| Industry | Aerospace & Defense | |
| Market Cap ⓘ | $4.64B | |
| Beta ⓘ | N/A | |
Value (Cheapness) | ||
| P/E Ratio ⓘ | 125.11 | 22.29 |
| P/B Ratio ⓘ | 11.10 | 1.98 |
| FCF Yield ⓘ | -0.60% | 6.26% |
| Dividend Yield ⓘ | N/A | 1.92% |
| EBIT / EV ⓘ | 1.89% | 4.83% |
| PEG ⓘ | N/A | |
Growth (Business expansion) | ||
| Revenue Growth ⓘ | 58.20% | 9.30% |
| RPS Growth (5Y CAGR) ⓘ | 27.67% | 7.76% |
| EPS Growth (5Y CAGR) ⓘ | N/A | -13.17% |
| BVPS Growth (5Y CAGR) ⓘ | 29.11% | 6.13% |
| Margin Growth (5Y Trend) ⓘ | 7.41% | 0.74% |
| FCF Growth (5Y CAGR) ⓘ | N/A | 10.79% |
| DPS Growth (5Y CAGR) ⓘ | 19.39% | 9.41% |
Quality (Business durability) | ||
| ROIC (Latest) ⓘ | 7.04% | 10.75% |
| ROA (Latest) ⓘ | 3.08% | 5.41% |
| ROIC (5Y Median) ⓘ | N/A | 9.37% |
| ROA (5Y Median) ⓘ | 1.71% | 4.95% |
| Net Debt / EBIT (Latest) ⓘ | 8.37 | 2.04 |
| Net Debt / EBIT (5Y Median) ⓘ | 7.71 | 2.27 |
| Net Debt / EBITDA (Latest) ⓘ | 5.33 | 1.39 |
| Net Debt / Assets ⓘ | 57.03% | 19.27% |
| EBITDA / Interest ⓘ | 3.14 | 9.58 |
| Operating Margin (Latest) ⓘ | 16.69% | 10.49% |
| Operating Margin (5Y Median) ⓘ | 16.91% | 10.30% |
| Debt to Equity (Latest) ⓘ | 207.85% | 64.82% |
| Profit Margin (Latest) ⓘ | 6.31% | 6.67% |
| Free Cash Flow (Latest) ⓘ | -$27.67M | |
Momentum (Price trend) | ||
| 3Y Return ⓘ | N/A | +67.77% |
| 12M Return (excl. last month) ⓘ | -46.75% | +12.05% |
| 6M Return ⓘ | -57.02% | 0.00% |
| Price vs. 200-Day MA ⓘ | -46.60% | +0.67% |
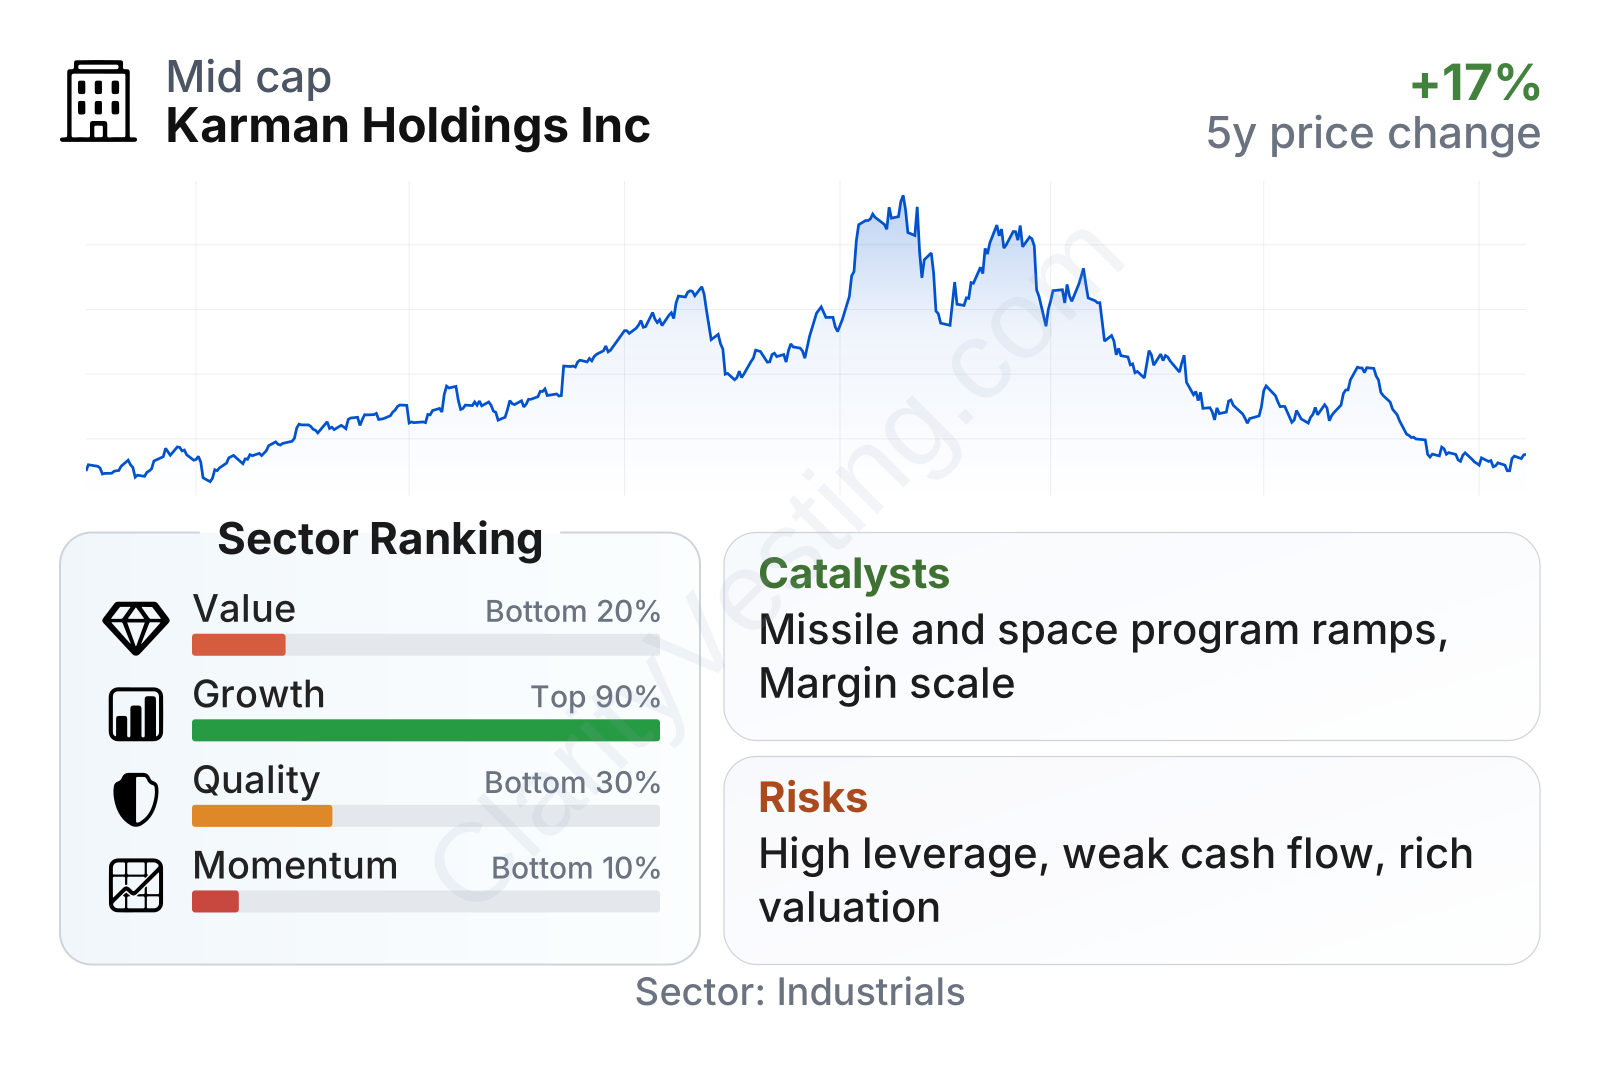
Karman is a mid-sized aerospace and defense company by market value. The profile shown here is unusual: growth ranks among the strongest in the sector, while valuation, balance-sheet strength, and share-price momentum rank among the weakest. Revenue growth is far above the industry median, and operating margins are actually better than many peers. However, returns on capital are lower than the sector median, free cash flow is still negative, and leverage is much heavier than what is typical in aerospace and defense. In short, the company looks operationally promising, but financially stretched.
The stock’s path also reflects that tension. It rose sharply after listing and reached a much higher level in early 2026, then gave back a meaningful portion of those gains. That pattern often signals a market reassessment: enthusiasm around growth remains, but investors have become more demanding about valuation, debt, and cash generation.
Growth
Karman operates in a part of the market that still has favorable structural support. Defense budgets in the United States remain focused on missile systems, strategic deterrence, survivability, and space capabilities. Those are not short-lived themes. In addition, the space economy continues to require specialized suppliers able to meet strict technical specifications, especially for launch and defense-linked missions. That gives the company exposure to end markets that are generally more resilient than many industrial niches.
The company’s recent growth has been very strong. Revenue growth in recent quarters has remained above 50% year over year, far ahead of the broader sector. That matters because it suggests Karman is not simply moving in line with the industry cycle; it appears to be gaining from program ramps, demand strength, or both.
Its broader multi-year record also supports that view. Revenue has more than doubled between 2022 and 2025, while operating margins stayed in the mid-to-high teens rather than collapsing under expansion costs. For an aerospace and defense manufacturer, that combination usually points to a favorable product mix and disciplined execution.
A key question for long-term analysis is whether accounting growth is turning into cash. On that point, the picture is improving but not fully convincing yet. Trailing free cash flow remains negative, although the shortfall has narrowed from late 2025 into early 2026. That may reflect working-capital needs tied to rapid expansion, but it still means the business has not yet fully converted its growth into excess cash.
The strategic logic behind future growth appears sound. If Karman is embedded in programs tied to missile defense, space launch, and other critical national security applications, the company may benefit from multi-year procurement cycles and follow-on production once systems move from development into larger-scale manufacturing. Public company communications in recent periods have also emphasized expanding participation in key defense and space programs, which is the type of opportunity that can materially extend growth if execution remains solid.
One notable catalyst is scale. As revenue grows, overhead can be spread across a larger base, which may support earnings improvement even if gross margins do not expand much further. Another potential catalyst is any reduction in financing burden over time, because a business already generating decent operating profit could show a much stronger bottom line if interest costs ease.
Risks
This article is for informational purposes only and does not constitute financial advice. Some content is AI-generated. See Disclaimer


