Stock Analysis · Kite Realty Group Trust (KRG)
Overview
Kite Realty Group Trust is a retail real estate investment trust, or REIT. In simple terms, it owns open-air shopping centers and mixed-use retail properties, then earns money mainly by leasing those spaces to tenants. Its portfolio is concentrated in higher-income suburban markets and is built around necessity-based shopping, everyday services, restaurants, fitness, and other uses that still attract in-person traffic. This makes the business less dependent on traditional enclosed malls and somewhat more tied to daily consumer activity.
The company’s revenue is overwhelmingly property-based. Based on company filings, the main sources of revenue can be summarized as follows:
- Rental income from retail properties: about 85% to 90%. This is the core business and includes base rent paid by tenants for store space in shopping centers and mixed-use assets.
- Tenant reimbursements and recoveries: about 10% to 15%. Tenants often repay part of common area maintenance, property taxes, insurance, and other operating costs.
- Other property-related income: less than 5%. This can include percentage rent, parking or ancillary income, and occasional fees tied to leasing or property operations.
- Asset sales and other non-recurring items: variable. These can materially affect accounting earnings in some periods, but they are not the main recurring source of cash generation.
Kite Realty is not the largest retail REIT in the market, but it is large enough to have meaningful scale, diversified tenants, and access to capital markets. Revenue has expanded strongly since 2021, while operating profitability has improved materially. At the same time, reported net income has been more volatile than revenue because property sales, depreciation, and financing costs can swing accounting results from one year to another.
The business mix shows a company that has become more efficient over time. Revenue climbed from the low $300 millions in 2021 to the mid $800 millions more recently, and operating income improved much faster than sales, pointing to stronger property-level economics and cost discipline. Interest expense remains a meaningful claim on earnings, which is normal for a real estate company, but it also explains why cash flow and operating trends are often more informative than net income alone.
Key Figures
| Metric | Value | Sector ⓘ |
|---|---|---|
| Date | Oct 17, 2026 | |
| Context | ||
| Sector | Real Estate | |
| Industry | REIT - Retail | |
| Market Cap ⓘ | $5.00B | |
| Beta ⓘ | 0.86 | |
Value (Cheapness) | ||
| P/E Ratio ⓘ | 15.03 | 17.38 |
| P/B Ratio ⓘ | 1.85 | 0.85 |
| FCF Yield ⓘ | 5.21% | 7.38% |
| Dividend Yield ⓘ | 4.73% | 4.85% |
| EBIT / EV ⓘ | 6.14% | 3.78% |
| PEG ⓘ | 3.14 | |
Growth (Business expansion) | ||
| Revenue Growth ⓘ | -8.00% | 5.30% |
| RPS Growth (5Y CAGR) ⓘ | 4.03% | 6.02% |
| EPS Growth (5Y CAGR) ⓘ | N/A | -11.37% |
| BVPS Growth (5Y CAGR) ⓘ | -21.04% | 0.45% |
| Margin Growth (5Y Trend) ⓘ | 56.88% | -0.22% |
| FCF Growth (5Y CAGR) ⓘ | 59.37% | 5.40% |
| DPS Growth (5Y CAGR) ⓘ | 20.53% | 5.02% |
Quality (Business durability) | ||
| ROIC (Latest) ⓘ | 7.88% | 5.69% |
| ROE (Latest) ⓘ | 11.66% | 7.56% |
| ROA (Latest) ⓘ | 5.22% | 2.85% |
| ROIC (5Y Median) ⓘ | 1.95% | 4.22% |
| ROE (5Y Median) ⓘ | 0.12% | 6.03% |
| ROA (5Y Median) ⓘ | 0.06% | 2.44% |
| Net Debt / EBIT (Latest) ⓘ | 6.91 | 7.59 |
| Net Debt / EBIT (5Y Median) ⓘ | 23.51 | 8.40 |
| Net Debt / EBITDA (Latest) ⓘ | 3.98 | 5.27 |
| Net Debt / Assets ⓘ | 52.29% | 37.76% |
| EBITDA / Interest ⓘ | 2.41 | 4.10 |
| Operating Margin (Latest) ⓘ | 58.57% | 35.29% |
| Operating Margin (5Y Median) ⓘ | 15.47% | 37.31% |
| Debt to Equity (Latest) ⓘ | 119.23% | 88.87% |
| Profit Margin (Latest) ⓘ | 41.81% | 19.61% |
| Free Cash Flow (Latest) ⓘ | $260.31M | |
Momentum (Price trend) | ||
| 3Y Return ⓘ | +37.65% | +30.75% |
| 12M Return (excl. last month) ⓘ | +20.90% | +4.36% |
| 6M Return ⓘ | -2.71% | -2.52% |
| Price vs. 200-Day MA ⓘ | -3.73% | -2.34% |
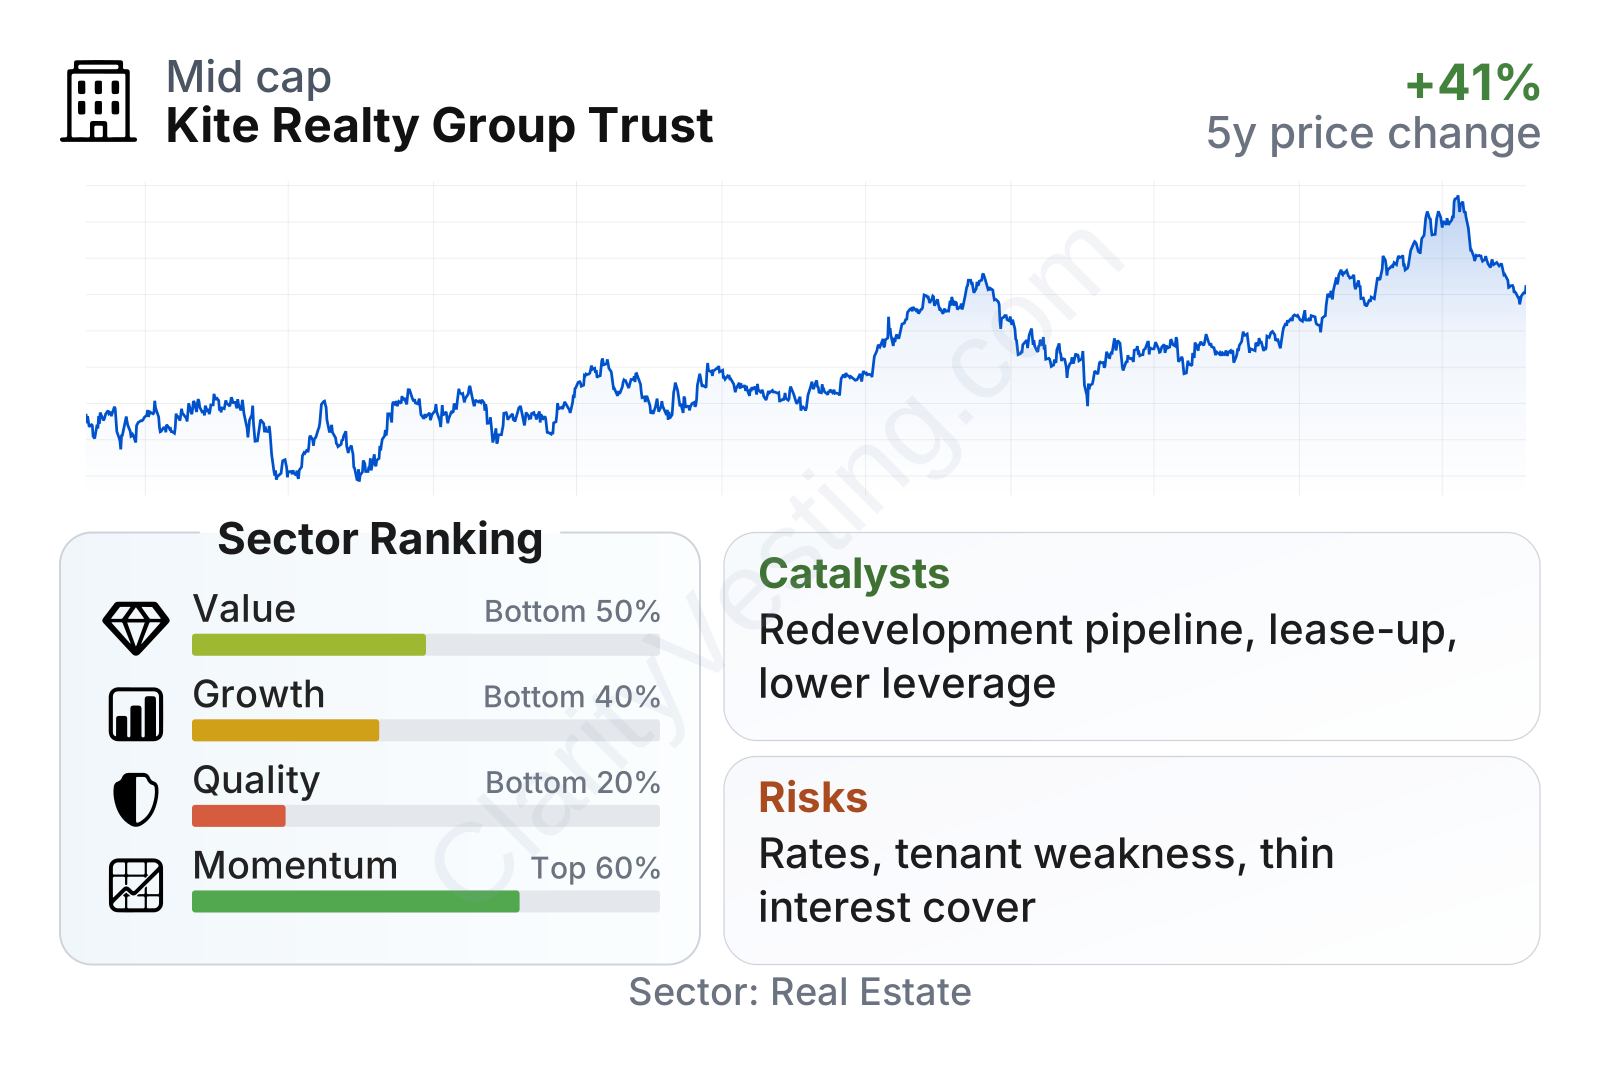
Kite Realty sits in the mid-cap range, with a stock that has shown solid multi-year appreciation and lower share-price volatility than the broader market, as suggested by its beta below 1. The factor snapshot is mixed. Valuation is not especially cheap relative to the real estate sector, mainly because the price-to-book ratio is well above the sector median, even though the earnings multiple is slightly below the median. Growth measures are weaker on a recent reported basis, but longer-term revenue per share, free cash flow, and dividend growth have been much better than that headline slowdown suggests. Profitability metrics such as return on assets and return on equity are currently above many peers, while balance sheet indicators show leverage that is manageable but still meaningful.
Growth
Retail real estate is no longer a broad high-growth sector in the way technology or some areas of health care can be, but open-air shopping centers have held up better than many feared a few years ago. The reason is practical: grocery stores, discount retail, restaurants, fitness, medical services, and daily-needs tenants still benefit from physical locations. That gives landlords like Kite Realty a clearer long-term role than owners of older mall formats that depend more heavily on discretionary fashion traffic.
Kite Realty’s strategy appears aligned with that backdrop. The company focuses on open-air centers in stronger demographic markets, with tenants that can generate repeat visits. It also uses redevelopment and re-leasing to improve existing properties rather than relying only on major external expansion. For a REIT, that can be an efficient way to grow because higher rents on existing space and upgrades to well-located assets often produce better returns than buying weaker properties just to add scale.
Revenue per share has trended steadily upward over the last several years, which matters because it shows growth on a per-share basis rather than growth created only by issuing more stock. The pace has not been spectacular, but it has been consistent, and that kind of gradual compounding is often a healthier sign in real estate than unstable bursts of expansion.
The dividend trend also points to improving fundamentals. Dividend per share has risen strongly since 2021, moving from a depressed base to a meaningfully higher level. That increase reflects a business that has regained cash-generating strength after earlier disruption in the retail property market. The trailing dividend yield remains close to the sector median, so most of the improvement has come from the underlying payout itself rather than from share-price weakness.
A notable growth catalyst is the combination of lease-up opportunities, contractual rent escalations, and redevelopment projects within the existing portfolio. Another supportive factor is that lower leverage than many peers can leave more room for capital recycling. If interest rates stabilize or decline, retail REIT valuations and financing conditions could also improve, which would help companies such as Kite Realty that depend on property spreads and debt markets. Recent operating trends and the stock’s stronger performance over the last year suggest the market has been recognizing this improving setup.
Risks
This article is for informational purposes only and does not constitute financial advice. Some content is AI-generated. See Disclaimer


