Stock Analysis · Kilroy Realty Corp (KRC)
Overview
Kilroy Realty Corp is a real estate investment trust, or REIT, focused mainly on owning, developing, and operating office properties. Its portfolio is concentrated in high-cost coastal U.S. markets, especially in California and the Pacific Northwest, with a strong presence in Los Angeles, San Diego, the San Francisco Bay Area, Greater Seattle, and Austin. The company has historically emphasized modern workplaces and life science-oriented real estate in innovation-driven locations.
Its business model is straightforward: Kilroy acquires land or buildings, develops or redevelops properties, leases space to tenants, and collects rent. As a REIT, it is designed to pass a large share of taxable income to shareholders through dividends, which makes stable property income especially important.
The largest sources of revenue are tied to recurring rental income from its real estate portfolio. Based on recent annual reporting, the mix is approximately as follows:
- Rental income from office properties: about 85% to 90% of total revenue. This includes base rent and other tenant-related real estate income from the company’s core office portfolio.
- Tenant recoveries and other property income: about 8% to 12%. This generally includes reimbursements for operating expenses, parking, and other building-related charges.
- Other real estate and ancillary income: less than 5%. This can include smaller non-core items tied to property operations and occasional service-related income.
Kilroy’s revenue base is therefore highly concentrated in office leasing, even though some of its buildings serve life science and technology tenants. That concentration matters because the long-term outlook depends heavily on office demand, occupancy, lease renewals, and the company’s ability to keep premium assets attractive in a market still adjusting to hybrid work.
The financial profile shows a business with revenue that has stayed broadly stable over the last few years, while interest costs have risen and profitability has become more pressured than earlier in the cycle.
Over the last several years, total revenue has remained around the low-$1 billion range, which suggests the portfolio has held up better than the stock price might imply. The more important change is lower earnings efficiency: interest expense has moved up materially, which has reduced the amount of profit left after financing costs.
Key Figures
| Metric | Value | Sector ⓘ |
|---|---|---|
| Date | Oct 17, 2026 | |
| Context | ||
| Sector | Real Estate | |
| Industry | REIT - Office | |
| Market Cap ⓘ | $3.91B | |
| Beta ⓘ | 1.19 | |
Value (Cheapness) | ||
| P/E Ratio ⓘ | 24.49 | 17.38 |
| P/B Ratio ⓘ | 0.78 | 0.85 |
| FCF Yield ⓘ | -6.15% | 7.38% |
| Dividend Yield ⓘ | 6.18% | 4.85% |
| EBIT / EV ⓘ | 4.57% | 3.78% |
| PEG ⓘ | 1.82 | |
Growth (Business expansion) | ||
| Revenue Growth ⓘ | -6.00% | 5.30% |
| RPS Growth (5Y CAGR) ⓘ | 3.44% | 6.02% |
| EPS Growth (5Y CAGR) ⓘ | -14.93% | -11.37% |
| BVPS Growth (5Y CAGR) ⓘ | -0.37% | 0.45% |
| Margin Growth (5Y Trend) ⓘ | -35.56% | -0.22% |
| FCF Growth (5Y CAGR) ⓘ | -44.49% | 5.40% |
| DPS Growth (5Y CAGR) ⓘ | 1.65% | 5.02% |
Quality (Business durability) | ||
| ROIC (Latest) ⓘ | N/A | 5.69% |
| ROE (Latest) ⓘ | 3.22% | 7.56% |
| ROA (Latest) ⓘ | 1.57% | 2.85% |
| ROIC (5Y Median) ⓘ | 2.90% | 4.22% |
| ROE (5Y Median) ⓘ | 4.48% | 6.03% |
| ROA (5Y Median) ⓘ | 2.18% | 2.44% |
| Net Debt / EBIT (Latest) ⓘ | 11.46 | 7.59 |
| Net Debt / EBIT (5Y Median) ⓘ | 11.75 | 8.40 |
| Net Debt / EBITDA (Latest) ⓘ | 5.85 | 5.27 |
| Net Debt / Assets ⓘ | 41.48% | 37.76% |
| EBITDA / Interest ⓘ | 3.71 | 4.10 |
| Operating Margin (Latest) ⓘ | 35.18% | 35.29% |
| Operating Margin (5Y Median) ⓘ | 33.31% | 37.31% |
| Debt to Equity (Latest) ⓘ | 89.25% | 88.87% |
| Profit Margin (Latest) ⓘ | 15.47% | 19.61% |
| Free Cash Flow (Latest) ⓘ | -$240.37M | |
Momentum (Price trend) | ||
| 3Y Return ⓘ | +34.47% | +30.75% |
| 12M Return (excl. last month) ⓘ | -15.94% | +4.36% |
| 6M Return ⓘ | +17.18% | -2.52% |
| Price vs. 200-Day MA ⓘ | +2.86% | -2.34% |
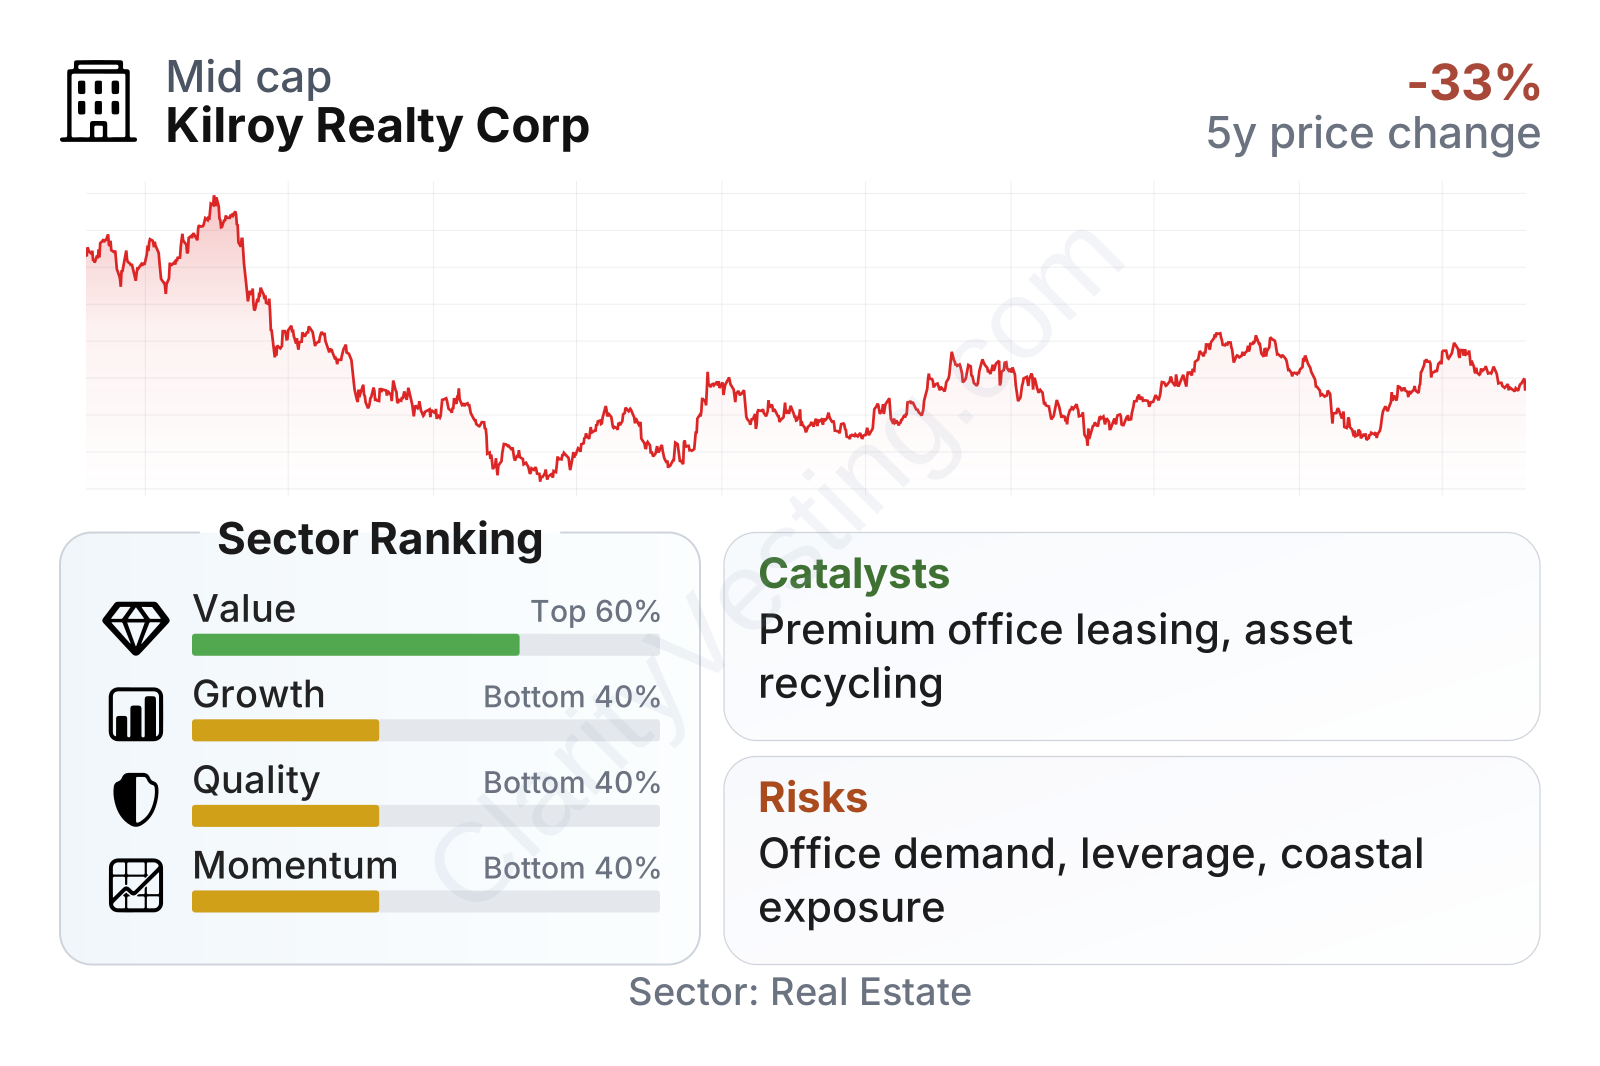
Kilroy sits in the mid-cap range and shows a mixed profile. On valuation, it trades below sector book value multiples but above the sector median on earnings multiples, which reflects how accounting earnings can look compressed in real estate while asset values still matter. Dividend yield is higher than the sector median, but growth, quality, and momentum rank in the lower part of the sector. The combination points to a company that still produces meaningful property income, yet is dealing with slower growth, weaker returns on assets and equity, and a balance sheet that is somewhat more stretched than many peers.
Growth
Kilroy operates in a sector with a split outlook. Office real estate overall is not currently a broad growth area in the way logistics, data centers, or cell towers are. However, premium office buildings in supply-constrained innovation markets may recover differently from lower-quality office stock. That is the part of the market where Kilroy is trying to position itself. Its strategy has centered on owning newer, amenity-rich, sustainability-focused buildings in neighborhoods that attract technology, media, and life science tenants.
The logic behind that strategy still makes sense in principle. Companies reducing total office footprints often prioritize better buildings over weaker ones, a trend sometimes described as “flight to quality.” If that continues, owners of high-end assets in strong submarkets could capture a larger share of leasing demand even if the office market as a whole grows slowly.
Revenue per share improved meaningfully from 2021 through 2023 and then flattened, before softening more recently. That pattern suggests Kilroy has already captured much of the easier post-pandemic recovery and now needs leasing progress, rent growth, or development stabilization to restart a clearer growth path.
Another support point is income continuity. The dividend per share has been relatively stable and slightly higher than it was a few years ago, which indicates the company has tried to preserve shareholder distributions through a difficult office cycle.
Dividend growth has been modest rather than dynamic. For a long-term view, that makes the key question less about rapid payout expansion and more about whether cash generation can sustainably support the current distribution while funding leasing, redevelopment, and debt obligations.
A practical catalyst is any improvement in office utilization and leasing in West Coast gateway markets. Another is successful lease-up of development and redevelopment projects, particularly if newer assets attract tenants away from older buildings. Public company communications have also emphasized balance sheet management, capital recycling, and maintaining liquidity, which could help if office conditions gradually normalize.
Recent opportunity signals are mostly tied to market structure rather than a single transformative event: a large gap has opened between well-located premium office assets and commodity office space. If that gap keeps widening, Kilroy’s property quality could become more valuable than broad office headlines suggest.
Risks
This article is for informational purposes only and does not constitute financial advice. Some content is AI-generated. See Disclaimer


