Stock Analysis · Keppel Corporation Limited (KPELF)
Overview
Keppel Corporation Limited is a Singapore-based asset manager and operator with businesses tied to infrastructure, real estate, and connectivity. Over the last few years, the company has been reshaping itself away from its older offshore and marine identity and toward what it calls global asset management and operating platforms. In simple terms, Keppel develops, owns, manages, and operates assets such as power and environmental infrastructure, data centers, logistics and commercial real estate, and selected connectivity-related businesses.
Its revenue base is spread across several activities, but public reporting shows that the largest economic drivers now come from infrastructure, real estate, and asset management-related activities. Based on recent annual reporting and segment disclosures, the business mix can be summarized approximately as follows:
- Infrastructure: about 40% to 45% of revenue. This includes energy infrastructure, environmental services, district heating and cooling, waste and water-related operations, and other essential utility-style assets.
- Real Estate: about 30% to 35% of revenue. This includes property development, urban renewal, commercial and residential projects, and earnings tied to real estate platforms and funds.
- Connectivity: about 15% to 20% of revenue. This mainly includes data centers and selected digital infrastructure activities.
- Asset Management and Other: generally a smaller share of direct revenue, but strategically important because fee income and capital recycling can support returns without requiring Keppel to keep all assets on its own balance sheet.
That revenue mix should be read with caution because Keppel’s structure is more complex than a straightforward industrial company: profits can also be influenced by asset sales, revaluations, development gains, and investment income. That helps explain why accounting earnings can move differently from reported revenue in a given year.
The long-term shift is clear, however. Keppel is trying to become a more recurring-income, platform-based business centered on energy transition, urbanization, and digital infrastructure rather than a cyclical builder of large industrial projects.
The operating picture over the last several years shows revenue staying in a fairly similar range overall, while profit has been much more volatile. That pattern suggests the company’s value creation is increasingly tied to portfolio actions, margin improvement, and monetization of assets rather than simple top-line expansion alone.
Key Figures
| Metric | Value | Sector ⓘ |
|---|---|---|
| Date | Oct 17, 2026 | |
| Context | ||
| Sector | Industrials | |
| Industry | Conglomerates | |
| Market Cap ⓘ | $15.27B | |
| Beta ⓘ | 0.53 | |
Value (Cheapness) | ||
| P/E Ratio ⓘ | 25.06 | 22.10 |
| P/B Ratio ⓘ | 1.44 | 1.97 |
| FCF Yield ⓘ | -0.51% | 6.38% |
| Dividend Yield ⓘ | 3.99% | 1.94% |
| EBIT / EV ⓘ | N/A | 4.79% |
| PEG ⓘ | 2.69 | |
Growth (Business expansion) | ||
| Revenue Growth ⓘ | 24.60% | 9.30% |
| RPS Growth (5Y CAGR) ⓘ | -2.46% | 7.81% |
| EPS Growth (5Y CAGR) ⓘ | -0.56% | -13.06% |
| BVPS Growth (5Y CAGR) ⓘ | -3.48% | 6.14% |
| Margin Growth (5Y Trend) ⓘ | 17.69% | 0.88% |
| FCF Growth (5Y CAGR) ⓘ | N/A | 11.01% |
| DPS Growth (5Y CAGR) ⓘ | 15.59% | 9.48% |
Quality (Business durability) | ||
| ROIC (Latest) ⓘ | N/A | 10.84% |
| ROA (Latest) ⓘ | 2.01% | 5.41% |
| ROIC (5Y Median) ⓘ | 4.34% | 9.38% |
| ROA (5Y Median) ⓘ | 3.19% | 4.95% |
| Net Debt / EBIT (Latest) ⓘ | 12.26 | 2.08 |
| Net Debt / EBIT (5Y Median) ⓘ | 7.13 | 2.27 |
| Net Debt / EBITDA (Latest) ⓘ | 8.28 | 1.39 |
| Net Debt / Assets ⓘ | 35.16% | 19.28% |
| EBITDA / Interest ⓘ | N/A | 9.58 |
| Operating Margin (Latest) ⓘ | 11.08% | 10.50% |
| Operating Margin (5Y Median) ⓘ | 21.40% | 10.29% |
| Debt to Equity (Latest) ⓘ | 106.54% | 65.48% |
| Profit Margin (Latest) ⓘ | 8.58% | 6.67% |
| Free Cash Flow (Latest) ⓘ | -$77.92M | |
Momentum (Price trend) | ||
| 3Y Return ⓘ | +98.82% | +61.68% |
| 12M Return (excl. last month) ⓘ | +48.53% | +12.58% |
| 6M Return ⓘ | -0.19% | 0.00% |
| Price vs. 200-Day MA ⓘ | +46.89% | +0.02% |
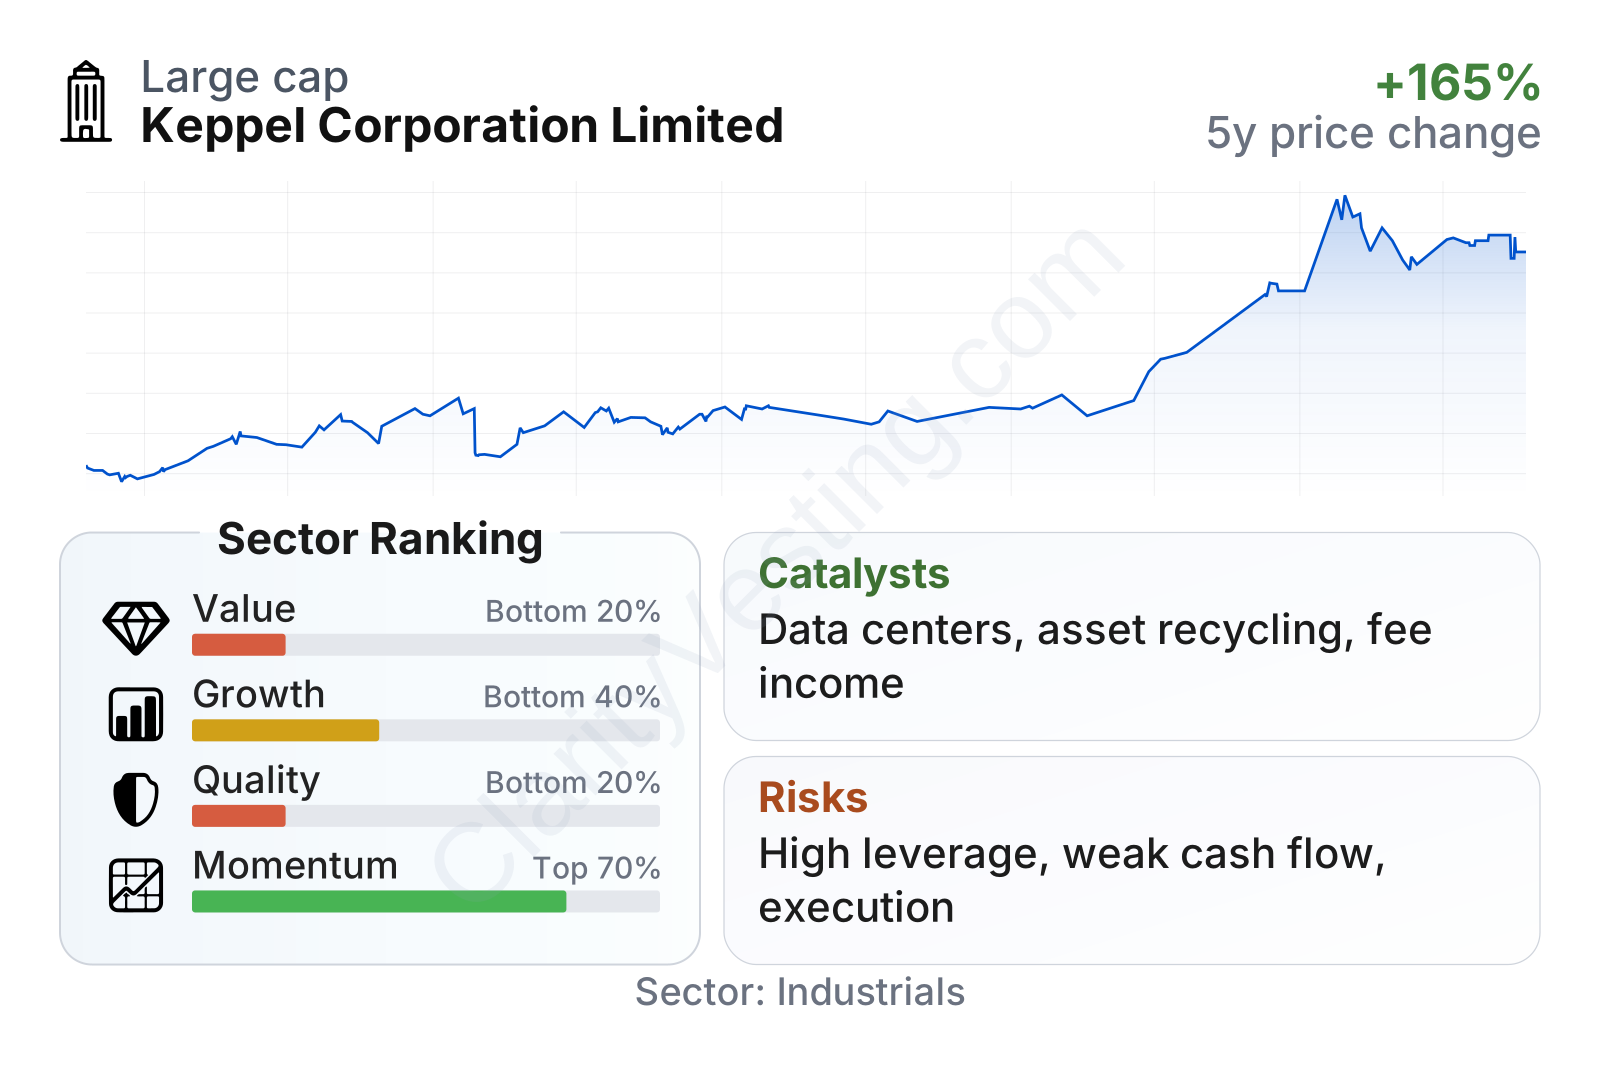
Keppel is a large-cap company with a relatively low share-price volatility profile, as shown by its beta well below 1. The broader factor picture is mixed. Growth and quality rank in the lower part of the industrial sector despite a strong recent revenue rebound, mainly because long-term per-share growth has been uneven and leverage is high. Value metrics also look less compelling than they first appear: the dividend yield is above the sector median, but free cash flow is currently negative and the earnings multiple is modestly above the sector median. Market performance has been strong over the last three years, meaning the stock has already rerated meaningfully.
Growth
Keppel operates in several sectors with structural growth support. Energy transition and environmental infrastructure benefit from long-term demand for cleaner, more efficient systems. Data centers and digital infrastructure are supported by cloud computing, AI workloads, and enterprise digitization. Urban renewal and logistics-related real estate also have durable demand drivers in major Asian markets. These are not temporary themes, and they fit the company’s current strategic direction better than its legacy businesses did.
The strategy also makes industrial sense. Keppel has been emphasizing an asset-light model: develop or acquire platforms, bring in third-party capital, earn management fees, and recycle capital into new opportunities. That approach can potentially improve returns and reduce the need to keep every project fully funded on its own balance sheet. For a company with meaningful debt, that strategic shift matters.
Recent growth has been uneven depending on the time frame. The most recent annual revenue growth rate is strong versus the sector median, but the latest midyear reading points to a decline from the prior year period. Over five years, revenue per share has contracted slightly, which shows that the transformation has not yet translated into a smooth long-term top-line expansion profile.
Cash generation is another important point. Free cash flow moved from positive to slightly negative on the more recent trend, and the trailing twelve-month figure is also negative. For a company repositioning around infrastructure and real assets, this is not automatically alarming because development timing and asset recycling can swing cash flow sharply, but it does mean growth is not yet showing up as consistently self-funding.
A meaningful catalyst is the continuing build-out of data center capacity and broader digital infrastructure demand across Asia and selected global markets. Another is the company’s ability to raise and deploy third-party capital into infrastructure and real estate vehicles, which can increase fee-based income. Recent corporate communications have also emphasized monetization, platform expansion, and capital recycling, all of which can unlock value if execution remains disciplined.
Risks
This article is for informational purposes only and does not constitute financial advice. Some content is AI-generated. See Disclaimer


