Stock Analysis · Kosmos Energy Ltd (KOS)
Overview
Kosmos Energy Ltd is an independent oil and gas exploration and production company. In simple terms, it looks for hydrocarbon resources, develops fields, and sells the oil and natural gas it produces. Its portfolio is centered on offshore assets, with a strong presence in West Africa and the U.S. Gulf of America, plus an important liquefied natural gas-linked position offshore Mauritania and Senegal through the Greater Tortue Ahmeyim project.
The business is largely driven by commodity production rather than downstream refining or consumer fuel sales. That means revenue depends mainly on how much oil and gas Kosmos can produce and the prices it receives in the market. Based on the company’s recent annual reporting, sales remain heavily weighted toward crude oil, with gas and liquefied natural gas-related volumes becoming more relevant as new projects ramp up.
The main revenue sources can be summarized as follows:
- Oil sales: approximately 75% to 85% of revenue in recent years. This includes production from key offshore fields in Ghana, Equatorial Guinea, and the U.S. Gulf of America.
- Natural gas sales: approximately 10% to 20%. This comes primarily from gas production and associated gas monetization, with future importance tied to large gas developments offshore Mauritania and Senegal.
- Other revenue: approximately 0% to 10%. This can include condensate, transportation-related items, and other field-level contractual revenue depending on the reporting period.
Kosmos is not one of the industry giants. It is a smaller exploration and production company competing by focusing on selected offshore basins where successful development can materially change its size and cash generation. That creates more upside from project execution than a diversified major would typically offer, but also more dependence on a limited number of assets.
Over the last several years, the business showed a clear pattern: healthy gross profit and operating income in 2022 through 2024, followed by a sharp deterioration in 2025. Revenue fell, production economics weakened, and profitability turned negative. Interest expense also remains meaningful, which matters because the company carries a heavier debt burden than many peers.
The financial flow over time shows how sensitive Kosmos is to commodity prices, field performance, and non-cash charges. Operations were solid in 2022 through 2024, but 2025 stands out as a break in the trend, with revenue pressure and negative profitability overwhelming what had previously been a workable operating structure.
Key Figures
| Metric | Value | Sector ⓘ |
|---|---|---|
| Date | Oct 17, 2026 | |
| Context | ||
| Sector | Energy | |
| Industry | Oil & Gas E&P | |
| Market Cap ⓘ | $1.66B | |
| Beta ⓘ | 0.88 | |
Value (Cheapness) | ||
| P/E Ratio ⓘ | N/A | 15.44 |
| P/B Ratio ⓘ | 2.32 | 1.73 |
| FCF Yield ⓘ | -0.96% | 8.20% |
| Dividend Yield ⓘ | N/A | 3.59% |
| EBIT / EV ⓘ | -5.11% | 7.46% |
| PEG ⓘ | -0.20 | |
Growth (Business expansion) | ||
| Revenue Growth ⓘ | 54.60% | 26.90% |
| RPS Growth (5Y CAGR) ⓘ | -4.00% | 6.90% |
| EPS Growth (5Y CAGR) ⓘ | -51.87% | -15.73% |
| BVPS Growth (5Y CAGR) ⓘ | -3.40% | 6.07% |
| Margin Growth (5Y Trend) ⓘ | -49.40% | 0.58% |
| FCF Growth (5Y CAGR) ⓘ | -24.79% | 1.86% |
| DPS Growth (5Y CAGR) ⓘ | N/A | 16.79% |
Quality (Business durability) | ||
| ROIC (Latest) ⓘ | -5.91% | 11.40% |
| ROA (Latest) ⓘ | -11.54% | 6.06% |
| ROIC (5Y Median) ⓘ | 6.32% | 10.30% |
| ROA (5Y Median) ⓘ | 3.71% | 5.42% |
| Net Debt / EBIT (Latest) ⓘ | N/A | 1.64 |
| Net Debt / EBIT (5Y Median) ⓘ | 5.53 | 1.83 |
| Net Debt / EBITDA (Latest) ⓘ | 8.24 | 1.08 |
| Net Debt / Assets ⓘ | 61.03% | 17.29% |
| EBITDA / Interest ⓘ | 1.45 | 9.64 |
| Operating Margin (Latest) ⓘ | -13.16% | 16.27% |
| Operating Margin (5Y Median) ⓘ | 20.50% | 20.39% |
| Debt to Equity (Latest) ⓘ | 391.02% | 54.76% |
| Profit Margin (Latest) ⓘ | -34.22% | 8.82% |
| Free Cash Flow (Latest) ⓘ | -$15.82M | |
Momentum (Price trend) | ||
| 3Y Return ⓘ | -64.85% | +67.38% |
| 12M Return (excl. last month) ⓘ | +74.85% | +49.19% |
| 6M Return ⓘ | +8.40% | +7.07% |
| Price vs. 200-Day MA ⓘ | +12.30% | +9.56% |
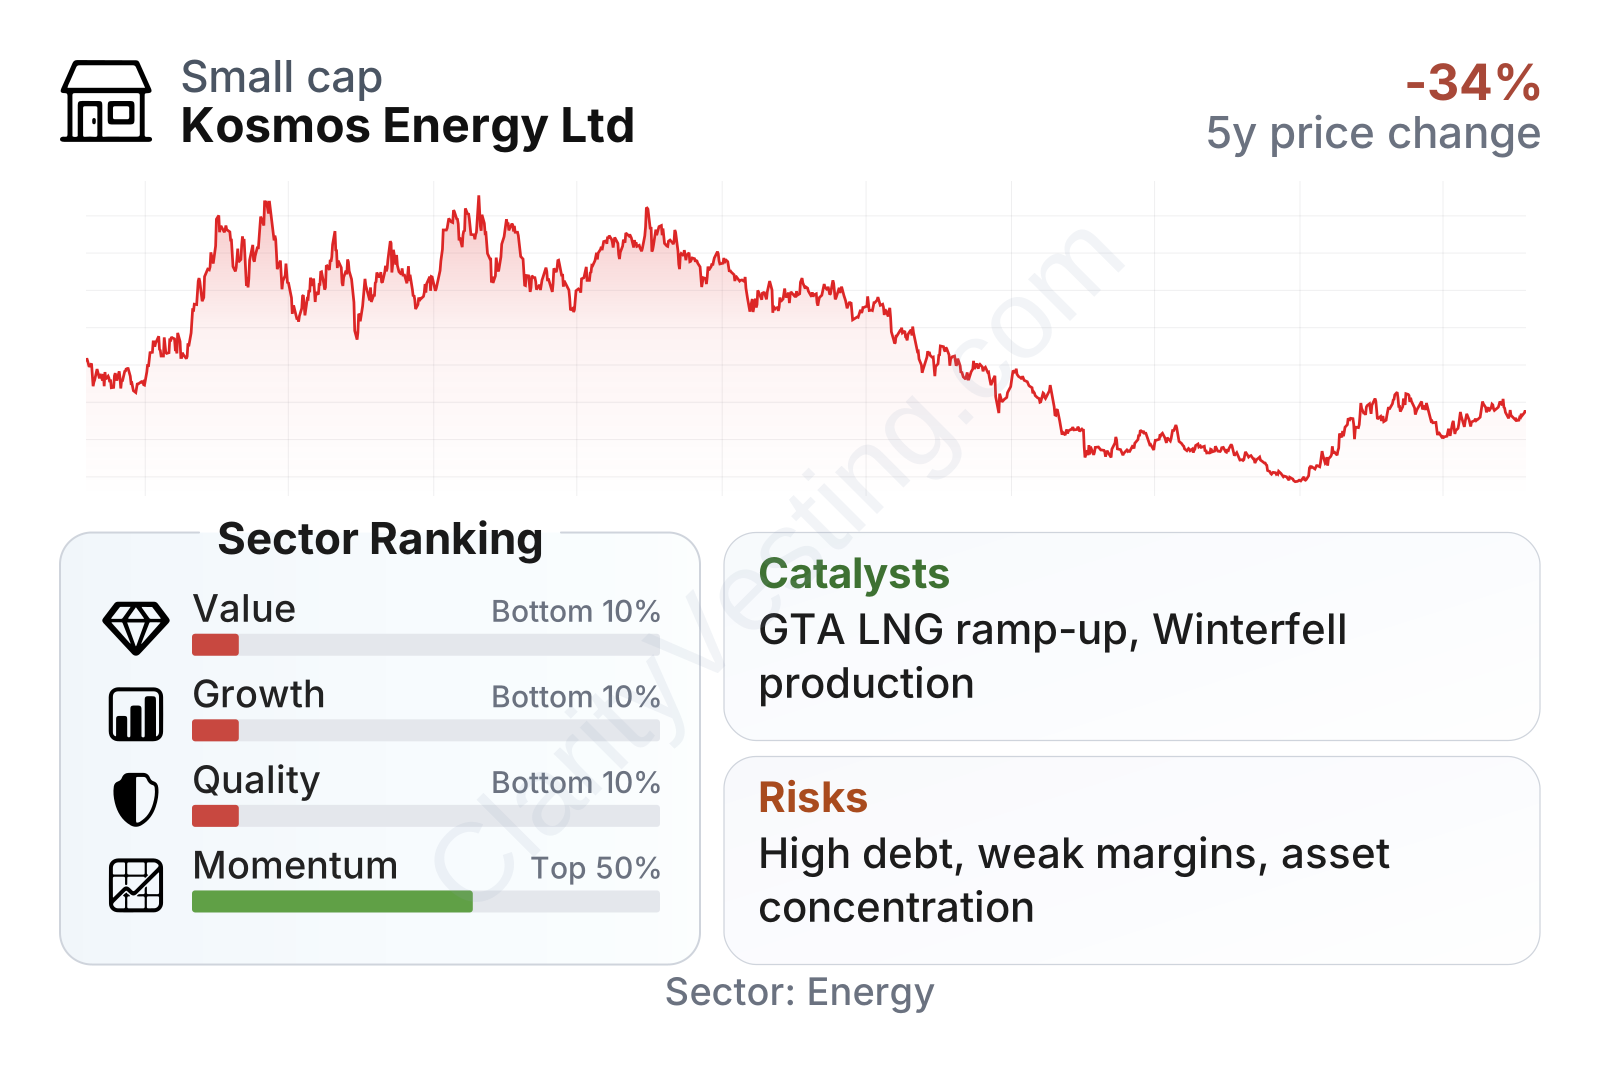
The stock has been extremely volatile over the last few years, including a steep decline from earlier highs and a partial rebound in 2026. In the latest factor snapshot, Kosmos ranks in the bottom 10% of its sector for value, growth, and quality, while momentum is somewhat better at around the top half of the sector. That combination points to a company whose recent share price recovery has improved trading performance, but whose operating and balance-sheet fundamentals remain weak relative to most energy peers.
Company size is in the small-cap range for the sector, and the beta is below 1, but that should not be confused with low business risk. In Kosmos’s case, operational concentration, leverage, and commodity exposure are much more important risk drivers than headline beta alone.
Growth
Oil and gas remains a large global industry, but long-term growth within the sector is uneven. The strongest structural demand trend is in natural gas, especially where it can feed LNG exports and displace higher-emission fuels in power generation. That matters for Kosmos because its most important medium-term growth angle is not simply producing more oil, but turning major gas resources into commercially useful output.
Kosmos’s strategy broadly makes industrial sense: keep cash-generating oil assets running while developing gas projects that could support longer-life production. The most important strategic asset in that plan is Greater Tortue Ahmeyim, the offshore Mauritania-Senegal LNG project. If that project ramps more smoothly and reaches stable output, it could improve production mix, reserve life, and market relevance.
The company also has producing positions in Ghana, Equatorial Guinea, and the U.S. Gulf of America. These assets provide current revenue and can support development spending, but they are not enough on their own to transform the company’s profile in the way a successful LNG-linked gas project could.
Recent revenue growth has improved sharply in 2026 after a difficult 2025, with year-over-year growth running well above the sector median. That said, the longer-term picture is less attractive. Over five years, revenue per share, earnings per share, book value per share, and free cash flow trends have all been weaker than the typical company in the sector. In other words, short-term recovery is visible, but it follows a period of meaningful damage.
Free cash flow remains one of the key points to watch. Kosmos has moved between positive and negative cash generation, and the trailing twelve months are still negative. For a company that depends on capital-intensive offshore assets, inconsistent free cash flow makes growth harder because it can increase reliance on borrowing, asset sales, or favorable commodity prices to fund operations and development.
A relevant recent opportunity is the continued commercialization and operational progress of the company’s gas portfolio, particularly Greater Tortue Ahmeyim and the Winterfell area in the Gulf of America. Public company updates in 2026 have highlighted production and project execution as central priorities. If these projects perform well, they could support stronger volumes and better cash conversion than the market currently expects from the depressed base created in 2025.
Risks
This article is for informational purposes only and does not constitute financial advice. Some content is AI-generated. See Disclaimer


