Stock Analysis · Kodiak Sciences Inc (KOD)
Overview
Kodiak Sciences is a biotechnology company focused on retinal diseases, meaning serious eye conditions that can damage vision. Its work centers on developing treatments for diseases such as wet age-related macular degeneration, diabetic retinopathy, and diabetic macular edema. These are large medical markets because they are linked to aging populations and diabetes, and many patients need repeated eye injections over long periods.
The company is still in the clinical-stage biotech category. In practical terms, that means it is spending heavily on research and trials but does not yet have an approved product generating recurring commercial sales. Its business value is therefore tied mainly to the quality of its drug pipeline, the results of clinical studies, and whether regulators eventually approve its lead programs.
Based on recent financial reporting, Kodiak’s revenue mix is unusually simple:
- Product revenue: 0% — no approved product sales at this stage.
- Collaboration or licensing revenue: not a meaningful recurring source disclosed recently — the business is not currently supported by a large partner-driven revenue stream.
- Financing-related cash sources: effectively the economic lifeline today — cash comes mainly from prior capital raises rather than operations, which is common for development-stage biotech companies.
The broader expense profile is more informative than revenue right now. Research and development is the dominant use of cash, while administrative costs are much smaller. That pattern fits a company trying to advance high-value eye-disease assets through late-stage development rather than a mature operating business.
The operating structure shows a company with no commercial revenue but a clear concentration of spending on research. R&D has consistently been the largest expense line, although total operating costs declined meaningfully in 2024 before rising again in 2025, reflecting pipeline prioritization rather than a fully stabilized cost base.
Key Figures
| Metric | Value | Sector ⓘ |
|---|---|---|
| Date | Oct 17, 2026 | |
| Context | ||
| Sector | Healthcare | |
| Industry | Biotechnology | |
| Market Cap ⓘ | $5.10B | |
| Beta ⓘ | 2.04 | |
Value (Cheapness) | ||
| P/E Ratio ⓘ | N/A | 24.79 |
| P/B Ratio ⓘ | 90.33 | 3.08 |
| FCF Yield ⓘ | -3.14% | 3.15% |
| Dividend Yield ⓘ | N/A | 1.94% |
| EBIT / EV ⓘ | -11.67% | 0.57% |
| PEG ⓘ | N/A | |
Growth (Business expansion) | ||
| Revenue Growth ⓘ | N/A | 7.45% |
| RPS Growth (5Y CAGR) ⓘ | N/A | 8.61% |
| EPS Growth (5Y CAGR) ⓘ | -26.75% | -17.81% |
| BVPS Growth (5Y CAGR) ⓘ | -30.68% | 3.72% |
| Margin Growth (5Y Trend) ⓘ | N/A | -0.62% |
| FCF Growth (5Y CAGR) ⓘ | -13.65% | 1.04% |
| DPS Growth (5Y CAGR) ⓘ | 35.80% | 6.77% |
Quality (Business durability) | ||
| ROIC (Latest) ⓘ | -210.86% | 3.24% |
| ROA (Latest) ⓘ | -101.92% | 3.01% |
| ROIC (5Y Median) ⓘ | -57.89% | 4.60% |
| ROA (5Y Median) ⓘ | -43.24% | 1.89% |
| Net Debt / EBIT (Latest) ⓘ | N/A | 1.34 |
| Net Debt / EBIT (5Y Median) ⓘ | N/A | 1.84 |
| Net Debt / EBITDA (Latest) ⓘ | N/A | 1.00 |
| Net Debt / Assets ⓘ | -11.76% | 5.45% |
| EBITDA / Interest ⓘ | N/A | 9.64 |
| Operating Margin (Latest) ⓘ | N/A | 9.27% |
| Operating Margin (5Y Median) ⓘ | N/A | 7.38% |
| Debt to Equity (Latest) ⓘ | 156.64% | 28.58% |
| Profit Margin (Latest) ⓘ | N/A | 3.59% |
| Free Cash Flow (Latest) ⓘ | -$159.90M | |
Momentum (Price trend) | ||
| 3Y Return ⓘ | +5008.41% | +42.80% |
| 12M Return (excl. last month) ⓘ | +252.83% | +18.50% |
| 6M Return ⓘ | +109.91% | +7.57% |
| Price vs. 200-Day MA ⓘ | +128.64% | +5.12% |
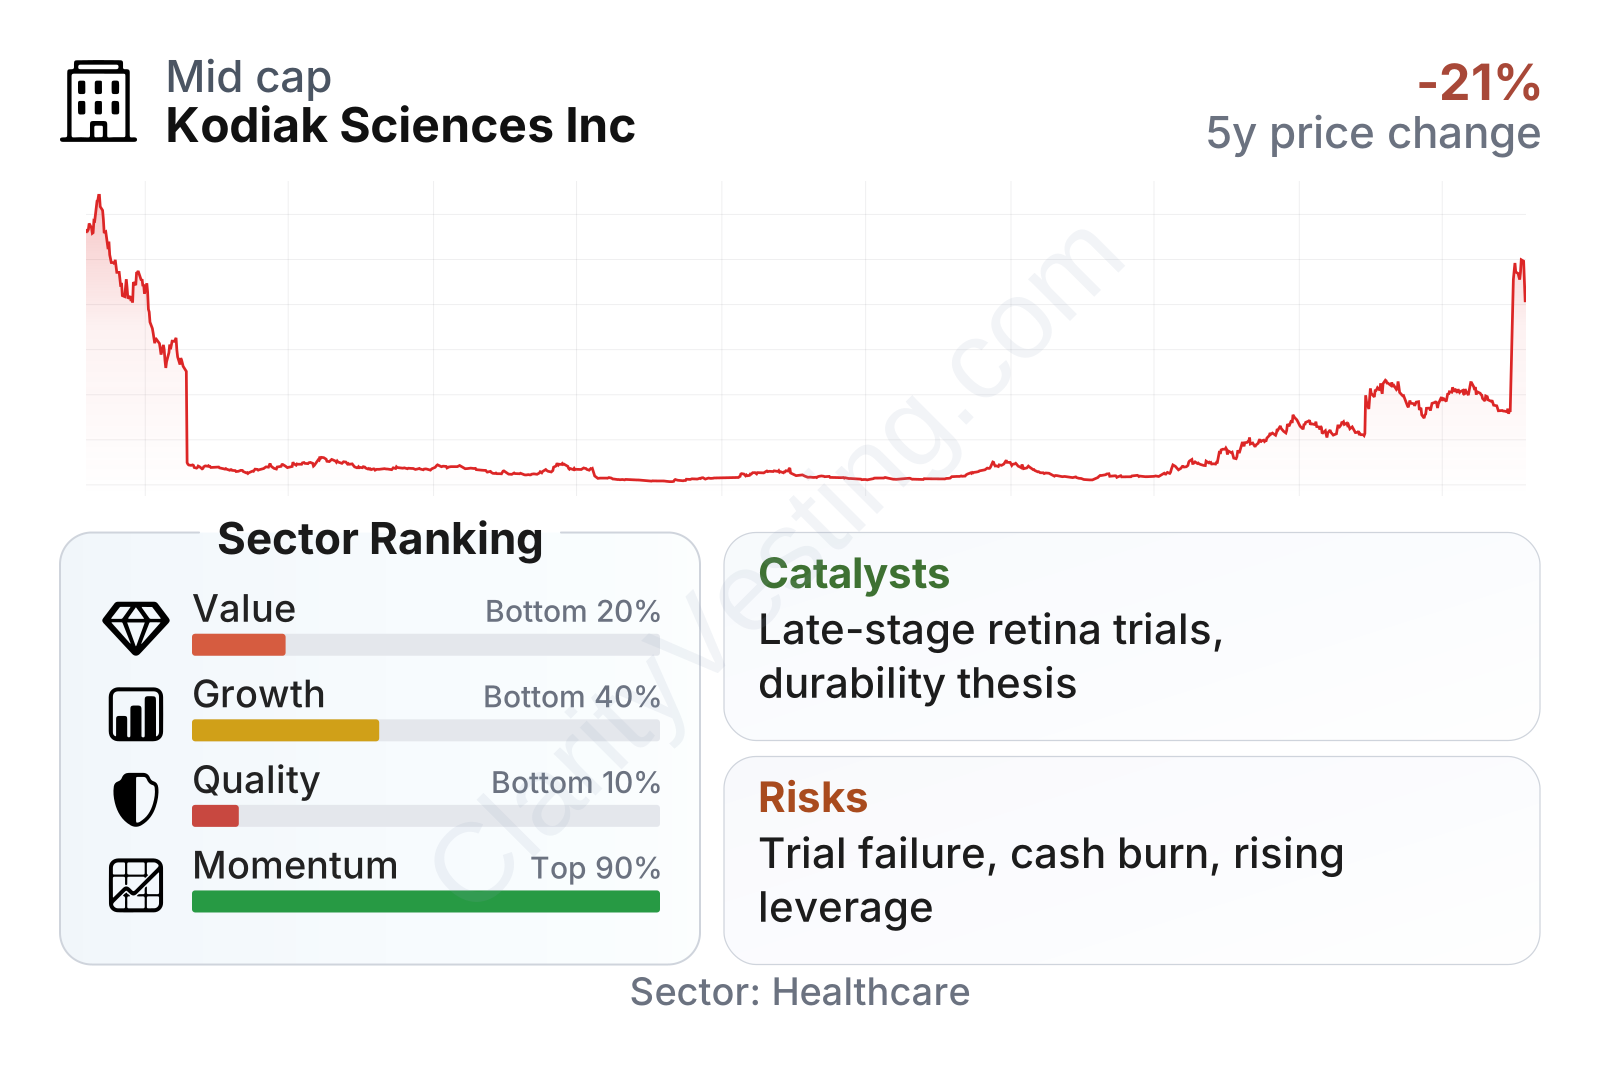
Kodiak’s profile is extreme even by biotechnology standards. The company now sits in a mid-cap range after a very sharp stock rebound, and price momentum has been exceptionally strong over the last year and over three years. At the same time, the underlying fundamentals remain weak: value, growth, and especially quality metrics rank near the bottom of the healthcare sector because the company still has no revenue base, negative cash flow, and deeply negative returns on capital. The very high price-to-book ratio also reflects how strongly the market is valuing future pipeline potential rather than current operating results.
The stock history highlights just how event-driven this name is. Shares collapsed from very high levels in 2021 to low single digits after major setbacks, then surged again in 2025 and 2026 as sentiment improved around the pipeline. That kind of swing is typical of clinical-stage biotech businesses where a few trial outcomes can dramatically reshape perceived value.
Growth
Kodiak operates in a market with attractive long-term demand. Retinal disease treatment is supported by aging demographics, rising diabetes prevalence, and the need for therapies that can preserve vision while reducing treatment burden. In this field, a drug that works as well as current standards but requires fewer injections can have meaningful commercial potential because it may improve convenience for both patients and physicians.
The company’s strategy is sensible in that context. Rather than trying to compete broadly across many diseases, Kodiak is focused on ophthalmology and on molecules designed for durability in the eye. If that approach produces stronger or longer-lasting efficacy, the company could target a market already worth billions of dollars globally. The strategic logic is straightforward: better durability can be a strong commercial differentiator in retinal care.
A key catalyst has been the company’s late-stage focus around tarcocimab tedromer and other retinal programs. Public company updates in 2025 and 2026 have pointed to continued clinical development and renewed market interest in whether Kodiak can re-establish credibility after earlier setbacks. In biotech, the most important growth trigger is not current sales growth but the transition from development to approval and launch. For Kodiak, that transition is still ahead rather than already proven.
Cash burn remains a central growth constraint. Free cash flow has stayed negative, but the burn rate improved significantly from 2022 into 2025 before moving somewhat lower again more recently. That pattern suggests management has shown some ability to moderate spending, yet the company still depends on external capital or a future business inflection to fund long development timelines.
One more recent positive signal is the market’s willingness to assign much higher equity value to the company than it had in prior years. That does not prove business success, but it can improve strategic flexibility by making future financing less punitive than when the shares traded near distressed levels.
Risks
This article is for informational purposes only and does not constitute financial advice. Some content is AI-generated. See Disclaimer


