Stock Analysis · Knight Transportation Inc (KNX)
Overview
Knight-Swift Transportation Holdings, whose roots include Knight Transportation, is one of the largest freight transportation companies in North America. It moves goods for shippers across the United States and Mexico through truckload services, less-than-truckload operations, intermodal, brokerage, and other logistics offerings. In simple terms, the company helps manufacturers, retailers, and distributors get products from one place to another, using both its own equipment and third-party transportation capacity.
The business is diversified across several transportation modes, which matters because trucking demand and pricing can swing sharply from year to year. Based on the company’s recent reporting, revenue is mainly generated from the following sources:
- Truckload: approximately 44% of revenue. This is the traditional full-trailer business, including irregular-route, dedicated, refrigerated, and expedited freight.
- Less-than-Truckload (LTL): approximately 14%. This segment combines smaller shipments from multiple customers into one network, a category that can be structurally more profitable when managed well.
- Logistics: approximately 24%. This includes brokerage and other asset-light services where the company arranges freight transportation rather than moving all shipments on its own trucks.
- Intermodal: approximately 8%. This business uses multiple transportation modes, typically truck plus rail, for cost-efficient long-haul moves.
- Other businesses: approximately 10%. This includes smaller operations such as warehousing, maintenance, insurance-related activities, and additional support services.
This mix shows that Knight-Swift is no longer just a truckload carrier. It has become a broader freight platform, which can help reduce dependence on any single market niche. Revenue has stayed fairly stable at a high level in recent years, but the more important issue has been profitability, which has come under pressure as freight conditions weakened.
The operating picture shows a clear shift since the peak freight years of 2021 and 2022. Revenue remained in roughly the same broad range afterward, but operating income and net income dropped sharply, while interest expense moved higher. That suggests the current debate is less about scale and more about whether margins can recover.
Key Figures
| Metric | Value | Sector ⓘ |
|---|---|---|
| Date | Oct 24, 2026 | |
| Context | ||
| Sector | Industrials | |
| Industry | Trucking | |
| Market Cap ⓘ | $10.29B | |
| Beta ⓘ | 1.21 | |
Value (Cheapness) | ||
| P/E Ratio ⓘ | 234.26 | 22.29 |
| P/B Ratio ⓘ | 1.48 | 1.98 |
| FCF Yield ⓘ | 11.05% | 6.26% |
| Dividend Yield ⓘ | 1.20% | 1.92% |
| EBIT / EV ⓘ | 1.65% | 4.83% |
| PEG ⓘ | 0.25 | |
Growth (Business expansion) | ||
| Revenue Growth ⓘ | 12.60% | 9.30% |
| RPS Growth (5Y CAGR) ⓘ | 6.31% | 7.76% |
| EPS Growth (5Y CAGR) ⓘ | -40.47% | -13.17% |
| BVPS Growth (5Y CAGR) ⓘ | 2.69% | 6.13% |
| Margin Growth (5Y Trend) ⓘ | -11.42% | 0.74% |
| FCF Growth (5Y CAGR) ⓘ | 3.86% | 10.79% |
| DPS Growth (5Y CAGR) ⓘ | 17.34% | 9.41% |
Quality (Business durability) | ||
| ROIC (Latest) ⓘ | 1.66% | 10.75% |
| ROA (Latest) ⓘ | 0.35% | 5.41% |
| ROIC (5Y Median) ⓘ | 2.55% | 9.37% |
| ROA (5Y Median) ⓘ | 1.78% | 4.95% |
| Net Debt / EBIT (Latest) ⓘ | 11.27 | 2.04 |
| Net Debt / EBIT (5Y Median) ⓘ | 7.95 | 2.27 |
| Net Debt / EBITDA (Latest) ⓘ | 2.47 | 1.39 |
| Net Debt / Assets ⓘ | 20.81% | 19.27% |
| EBITDA / Interest ⓘ | 7.50 | 9.58 |
| Operating Margin (Latest) ⓘ | 2.87% | 10.49% |
| Operating Margin (5Y Median) ⓘ | 3.89% | 10.30% |
| Debt to Equity (Latest) ⓘ | 38.45% | 64.82% |
| Profit Margin (Latest) ⓘ | 0.56% | 6.67% |
| Free Cash Flow (Latest) ⓘ | $1.14B | |
Momentum (Price trend) | ||
| 3Y Return ⓘ | +28.15% | +67.77% |
| 12M Return (excl. last month) ⓘ | +68.43% | +12.05% |
| 6M Return ⓘ | -2.03% | 0.00% |
| Price vs. 200-Day MA ⓘ | -3.58% | +0.67% |
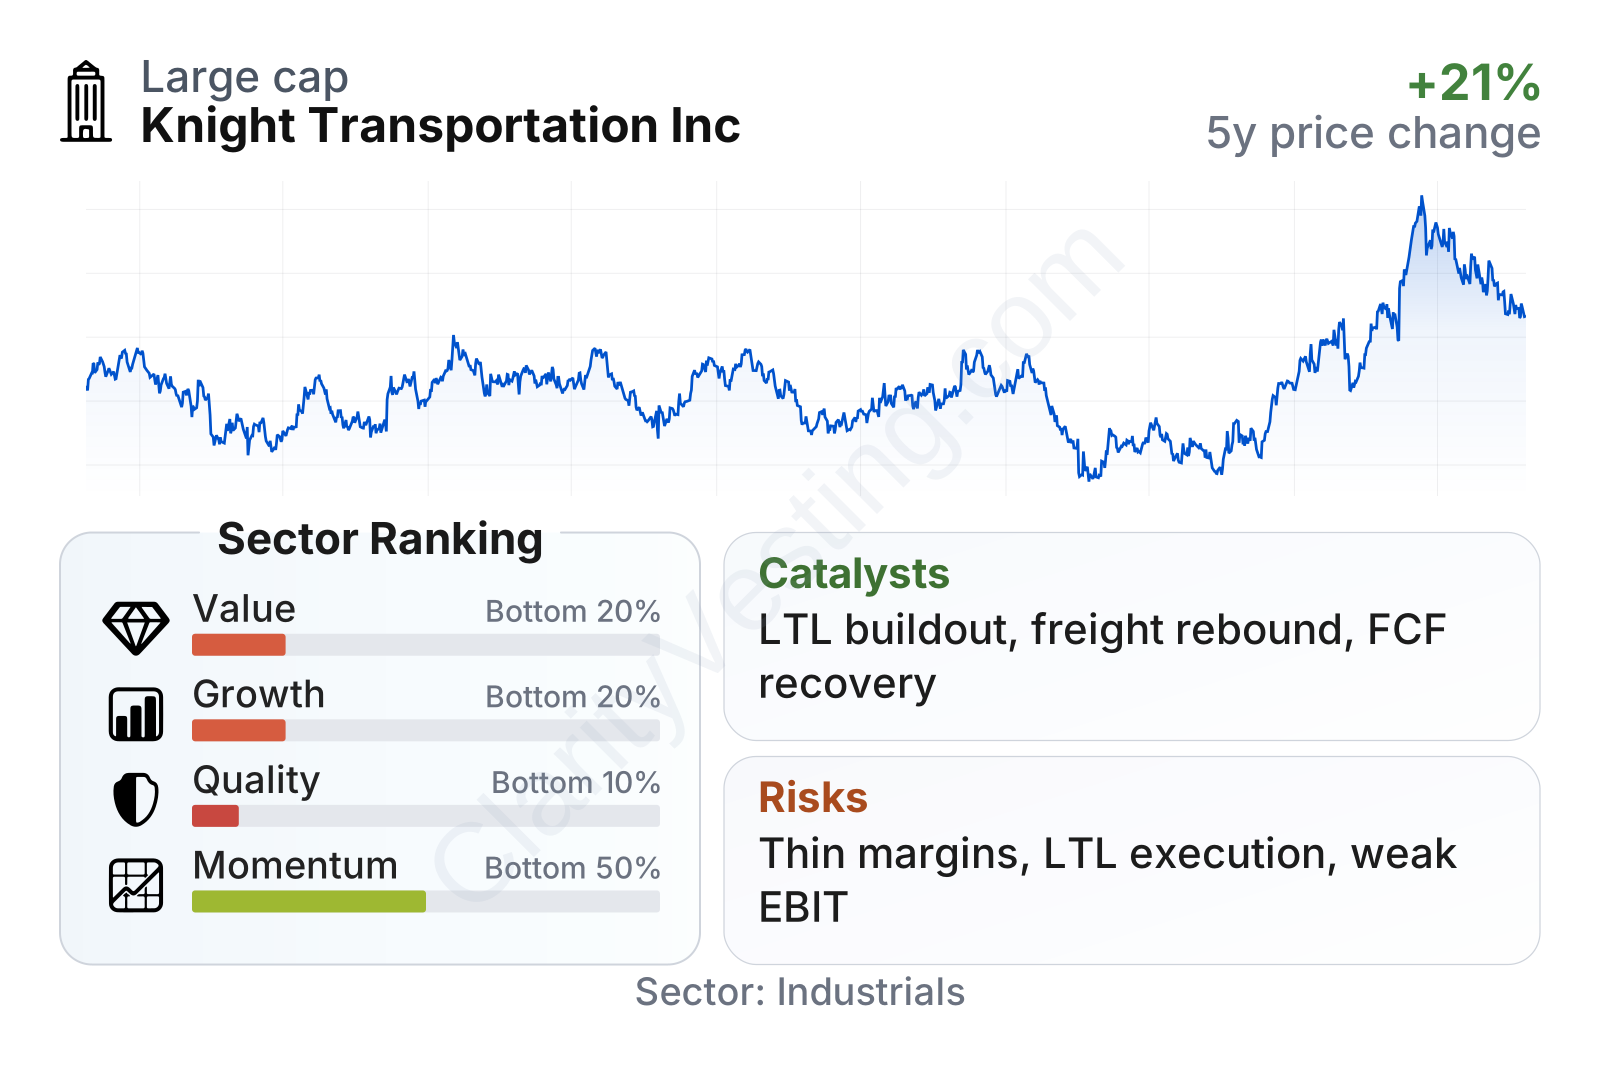
Knight-Swift is a large company in the trucking industry, with share price performance that has strengthened over the last year. The market metrics are mixed, though. Free cash flow yield stands out positively versus the sector, but earnings-based valuation looks stretched because recent profits are unusually low. Quality and growth rankings sit in the lower part of the sector, reflecting weak returns on capital, compressed margins, and a sharp decline in earnings over the last five years. Balance sheet leverage is not extreme by trucking standards, but profit generation currently does not look strong enough to make the valuation simple or comfortable.
Growth
Freight transportation is a necessary industry, but it is not a smooth-growth business. Over the long run, demand tends to follow industrial production, consumer spending, inventory movement, e-commerce, and cross-border trade. That gives the sector a durable economic role, yet pricing can be cyclical because too many trucks chasing too little freight quickly hurts rates.
Knight-Swift’s strategy for future expansion is logical. The company has spent years broadening its platform beyond standard truckload into logistics, intermodal, and especially LTL. That matters because LTL generally offers better structural economics than truckload, with more pricing discipline and higher barriers to entry due to terminal networks, local density, and service complexity. The company’s acquisitions in this area and investments in network development could become an important earnings lever if execution improves and the freight cycle normalizes.
Recent revenue growth has turned positive again after a volatile stretch. The latest year-over-year pace is above the sector median, which suggests freight demand or mix has improved. Still, the longer pattern shows irregular growth rather than a clean upward trend, so the central question is whether stronger sales can translate into meaningfully better margins.
Cash generation improved sharply in the most recent trailing period after a weak phase that even included negative free cash flow. That rebound is encouraging because trucking is capital intensive: fleets, trailers, terminals, and maintenance consume large amounts of cash. Stronger free cash flow gives the company more flexibility to invest in its network, manage debt, and continue shareholder returns without relying too heavily on external funding.
A practical catalyst is any sustained recovery in freight rates and network utilization. If truckload conditions improve while LTL integration continues to mature, earnings could change faster than revenue alone would suggest. Additional opportunity also comes from cross-selling: a shipper using one service can be introduced to brokerage, intermodal, dedicated, or LTL solutions from the same provider.
Risks
This article is for informational purposes only and does not constitute financial advice. Some content is AI-generated. See Disclaimer


