Stock Analysis · Kinetik Holdings Inc (KNTK)
Overview
Kinetik Holdings Inc is a midstream energy company. In simple terms, it owns infrastructure that helps move natural gas, natural gas liquids, crude oil, and produced water from oil and gas wells to processing plants, pipelines, and end markets. Its assets are concentrated in the Permian Basin, especially the Delaware Basin in West Texas and New Mexico, one of the most important oil and gas producing regions in the United States.
The business is built around gathering systems, gas processing plants, transmission pipelines, and water handling networks. That matters because midstream companies usually earn fees for providing these services, which can make their cash flows steadier than those of producers that depend directly on oil and gas prices.
Based on recent company reporting, Kinetik’s revenue is mainly generated from a few core activities:
- Natural gas gathering, transportation, and processing: approximately 55% to 65% of revenue. This includes collecting raw gas from wells, moving it through pipelines, and processing it so it can be sold or transported onward.
- Natural gas liquids and residue gas sales/marketing: approximately 20% to 30% of revenue. This reflects the sale and handling of products separated during processing, such as NGLs and marketable gas.
- Crude oil gathering and stabilization services: approximately 10% to 15% of revenue. These services support producers by moving and preparing crude for shipment.
- Produced water gathering and disposal: generally a smaller but growing share of revenue. This business handles wastewater generated during oil and gas production.
There is an important nuance: revenue does not tell the whole economic story for a midstream operator. Some product sales can inflate reported revenue while fee-based contracts often drive the more stable portion of cash generation. Kinetik’s portfolio is still centered on infrastructure-backed earnings rather than pure commodity exposure.
The company has also expanded through acquisitions and large-scale projects, which has helped lift total revenue from roughly $0.7 billion in 2021 to around $1.8 billion in 2025. Over that period, operating income improved even faster, showing that scale and asset integration have mattered.
The long-term pattern is favorable: revenue has increased materially, while operating income and net income have generally grown faster than costs. Interest expense remains meaningful, but the business mix looks more profitable today than it did several years ago.
Key Figures
| Metric | Value | Sector ⓘ |
|---|---|---|
| Date | Oct 17, 2026 | |
| Context | ||
| Sector | Energy | |
| Industry | Oil & Gas Midstream | |
| Market Cap ⓘ | $9.40B | |
| Beta ⓘ | 0.79 | |
Value (Cheapness) | ||
| P/E Ratio ⓘ | 19.42 | 15.44 |
| P/B Ratio ⓘ | N/A | 1.73 |
| FCF Yield ⓘ | 2.07% | 8.20% |
| Dividend Yield ⓘ | 5.89% | 3.59% |
| EBIT / EV ⓘ | 10.06% | 7.46% |
| PEG ⓘ | 8.62 | |
Growth (Business expansion) | ||
| Revenue Growth ⓘ | 36.30% | 26.90% |
| RPS Growth (5Y CAGR) ⓘ | 12.60% | 6.90% |
| EPS Growth (5Y CAGR) ⓘ | -20.36% | -15.73% |
| BVPS Growth (5Y CAGR) ⓘ | N/A | 6.07% |
| Margin Growth (5Y Trend) ⓘ | 29.25% | 0.58% |
| FCF Growth (5Y CAGR) ⓘ | -16.46% | 1.86% |
| DPS Growth (5Y CAGR) ⓘ | 55.80% | 16.79% |
Quality (Business durability) | ||
| ROIC (Latest) ⓘ | 28.51% | 11.40% |
| ROA (Latest) ⓘ | 6.62% | 6.06% |
| ROIC (5Y Median) ⓘ | 24.49% | 10.30% |
| ROA (5Y Median) ⓘ | 3.67% | 5.42% |
| Net Debt / EBIT (Latest) ⓘ | 4.80 | 1.64 |
| Net Debt / EBIT (5Y Median) ⓘ | 8.63 | 1.83 |
| Net Debt / EBITDA (Latest) ⓘ | 3.23 | 1.08 |
| Net Debt / Assets ⓘ | 55.11% | 17.29% |
| EBITDA / Interest ⓘ | 5.51 | 9.64 |
| Operating Margin (Latest) ⓘ | 43.88% | 16.27% |
| Operating Margin (5Y Median) ⓘ | 32.17% | 20.39% |
| Debt to Equity (Latest) ⓘ | -335.58% | 54.76% |
| Profit Margin (Latest) ⓘ | 29.18% | 8.82% |
| Free Cash Flow (Latest) ⓘ | $194.17M | |
Momentum (Price trend) | ||
| 3Y Return ⓘ | +89.49% | +67.38% |
| 12M Return (excl. last month) ⓘ | +34.10% | +49.19% |
| 6M Return ⓘ | +19.97% | +7.07% |
| Price vs. 200-Day MA ⓘ | +16.87% | +9.56% |
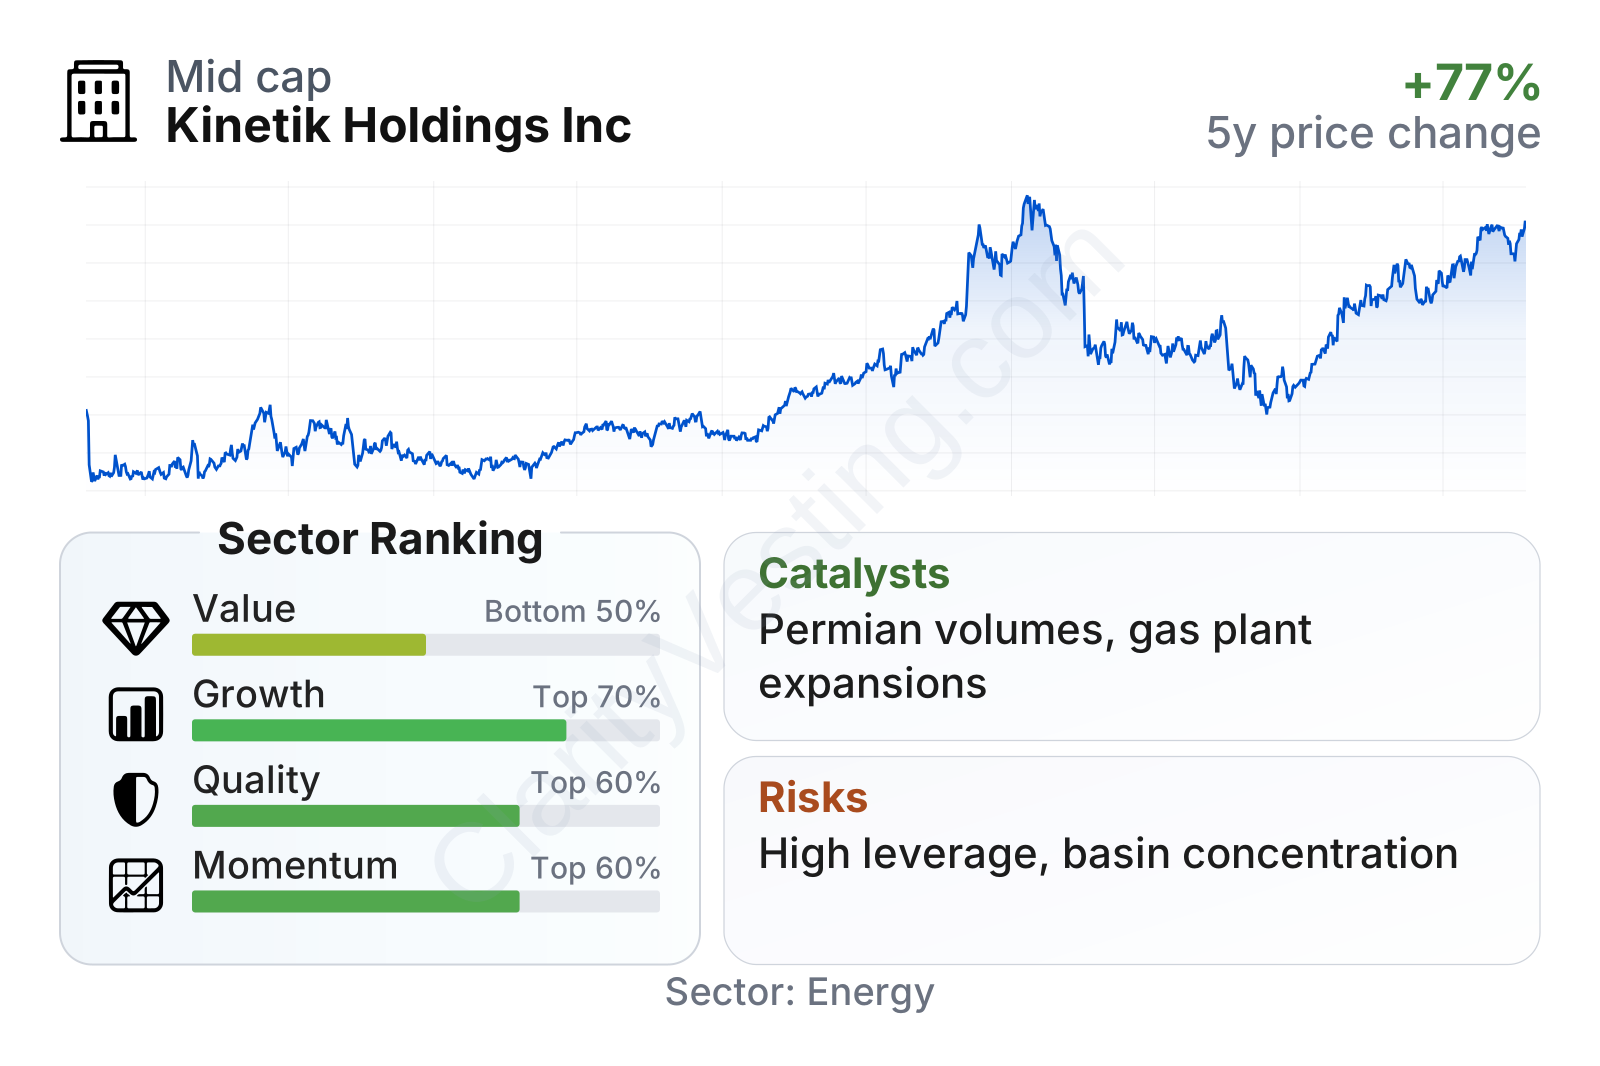
Kinetik sits in the mid-cap range within the energy sector and has shown lower share-price volatility than the broader market, with a beta below 1. The factor profile is mixed but interesting: profitability and returns on capital are strong versus many sector peers, growth metrics are above average in several areas, and valuation is not clearly cheap on every measure. Income generation stands out, with a trailing dividend yield around 6% versus a sector median closer to 4%, although free-cash-flow yield is weaker than the sector median. That combination suggests the market is recognizing quality and income characteristics, but not treating the shares as deeply discounted.
Growth
Kinetik operates in a sector that still has room for expansion, even though it is not a high-tech growth industry. The key driver is the Permian Basin. As long as production in that region remains resilient, demand for gathering, processing, takeaway, compression, and water infrastructure should remain significant. Midstream companies with well-placed assets can grow by connecting more wells, adding processing capacity, and increasing throughput on existing systems.
Kinetik’s strategy appears consistent with that opportunity. It is focused on owning integrated infrastructure in one of the most active U.S. hydrocarbon basins. That creates a network effect: once pipelines, processing plants, and water systems are in place, producers often prefer to keep using nearby, connected infrastructure rather than shift volumes elsewhere. This can support volume growth with less risk than entering entirely new regions.
Revenue growth has not been smooth every quarter, which is normal in energy-linked businesses, but the broader pattern remains positive. Recent year-over-year growth has reaccelerated, and the latest reading is above the sector median. Over a five-year period, revenue per share has also grown faster than the median company in the sector, which points to real business expansion rather than only temporary pricing effects.
Free cash flow has remained positive over time, which is important for a capital-intensive company. The level has moved around from year to year, but Kinetik has continued to produce meaningful cash after capital spending. That gives the company flexibility to support dividends, fund projects, and manage debt, although leverage still limits how much room it has.
A major catalyst for future growth is continued infrastructure demand in the Delaware Basin. If drilling activity and production volumes stay healthy, Kinetik can benefit from higher utilization on existing assets and incremental expansions. Another important catalyst is contract-backed project development: when producers commit volumes in advance, new infrastructure can come online with clearer visibility on returns.
Recent company updates have also highlighted ongoing system expansions and commercial activity tied to gas processing and takeaway capacity. For a company like Kinetik, these operational milestones matter more than headline commodity price moves because they shape long-term fee generation and throughput growth.
Risks
This article is for informational purposes only and does not constitute financial advice. Some content is AI-generated. See Disclaimer


