Stock Analysis · Kestra Medical Technologies Ltd (KMTS)
Overview
Kestra Medical Technologies is a healthcare company focused on cardiac monitoring and protection outside the hospital. Its main product is a wearable cardioverter defibrillator system called the ASSURE system, designed for patients who are at temporary high risk of sudden cardiac arrest. In simple terms, the device monitors a patient’s heart continuously and can automatically deliver a life-saving shock if a dangerous rhythm appears. The company is building its business around a service model that includes the device, related monitoring capabilities, and support tied to patient use.
Revenue appears to come overwhelmingly from one operating area: the ASSURE wearable defibrillator platform and the related patient-use service. In its public filings, Kestra does not report multiple large business segments with separate material revenue lines, so the practical revenue picture is concentrated rather than diversified.
- Wearable defibrillator system and related services: approximately close to 100% of revenue. This includes use of the ASSURE wearable cardioverter defibrillator, associated supplies, and support tied to the monitoring and therapy service model.
- Other revenue sources: no other separately meaningful revenue stream is clearly disclosed as a material contributor at this stage.
This concentration can be attractive when one product fits a clear medical need and adoption is rising, but it also means company performance depends heavily on execution in a single category. The business is still in commercial buildout mode rather than in a mature, diversified phase. Over the last few years, revenue has scaled up sharply, and gross profit has improved from negative territory to a more meaningful positive level. At the same time, operating costs have increased even faster, especially selling and administrative expenses, reflecting expansion efforts.
The revenue mix is simple, but the cost structure is not yet settled. Sales growth has been strong, gross profit has improved materially, and the company is spending aggressively to expand its commercial footprint. That combination is typical of an early-stage medical technology rollout, where the key question is not demand alone, but whether rising revenue can eventually outpace commercialization costs.
Key Figures
| Metric | Value | Sector ⓘ |
|---|---|---|
| Date | Oct 17, 2026 | |
| Context | ||
| Sector | Healthcare | |
| Industry | Medical Instruments & Supplies | |
| Market Cap ⓘ | $1.52B | |
| Beta ⓘ | N/A | |
Value (Cheapness) | ||
| P/E Ratio ⓘ | N/A | 24.79 |
| P/B Ratio ⓘ | 7.55 | 3.08 |
| FCF Yield ⓘ | -8.09% | 3.15% |
| Dividend Yield ⓘ | N/A | 1.94% |
| EBIT / EV ⓘ | -10.03% | 0.57% |
| PEG ⓘ | N/A | |
Growth (Business expansion) | ||
| Revenue Growth ⓘ | 59.90% | 7.45% |
| RPS Growth (5Y CAGR) ⓘ | N/A | 8.61% |
| EPS Growth (5Y CAGR) ⓘ | -58.29% | -17.81% |
| BVPS Growth (5Y CAGR) ⓘ | 162.57% | 3.72% |
| Margin Growth (5Y Trend) ⓘ | N/A | -0.62% |
| FCF Growth (5Y CAGR) ⓘ | N/A | 1.04% |
| DPS Growth (5Y CAGR) ⓘ | 7.94% | 6.77% |
Quality (Business durability) | ||
| ROIC (Latest) ⓘ | -38.57% | 3.24% |
| ROA (Latest) ⓘ | -50.46% | 3.01% |
| ROIC (5Y Median) ⓘ | N/A | 4.60% |
| ROA (5Y Median) ⓘ | -177.63% | 1.89% |
| Net Debt / EBIT (Latest) ⓘ | N/A | 1.34 |
| Net Debt / EBIT (5Y Median) ⓘ | N/A | 1.84 |
| Net Debt / EBITDA (Latest) ⓘ | N/A | 1.00 |
| Net Debt / Assets ⓘ | 2.27% | 5.45% |
| EBITDA / Interest ⓘ | N/A | 9.64 |
| Operating Margin (Latest) ⓘ | -131.27% | 9.27% |
| Operating Margin (5Y Median) ⓘ | -246.51% | 7.38% |
| Debt to Equity (Latest) ⓘ | 34.38% | 28.58% |
| Profit Margin (Latest) ⓘ | -140.43% | 3.59% |
| Free Cash Flow (Latest) ⓘ | -$122.78M | |
Momentum (Price trend) | ||
| 3Y Return ⓘ | N/A | +42.80% |
| 12M Return (excl. last month) ⓘ | +11.02% | +18.50% |
| 6M Return ⓘ | +42.05% | +7.57% |
| Price vs. 200-Day MA ⓘ | +21.59% | +5.12% |
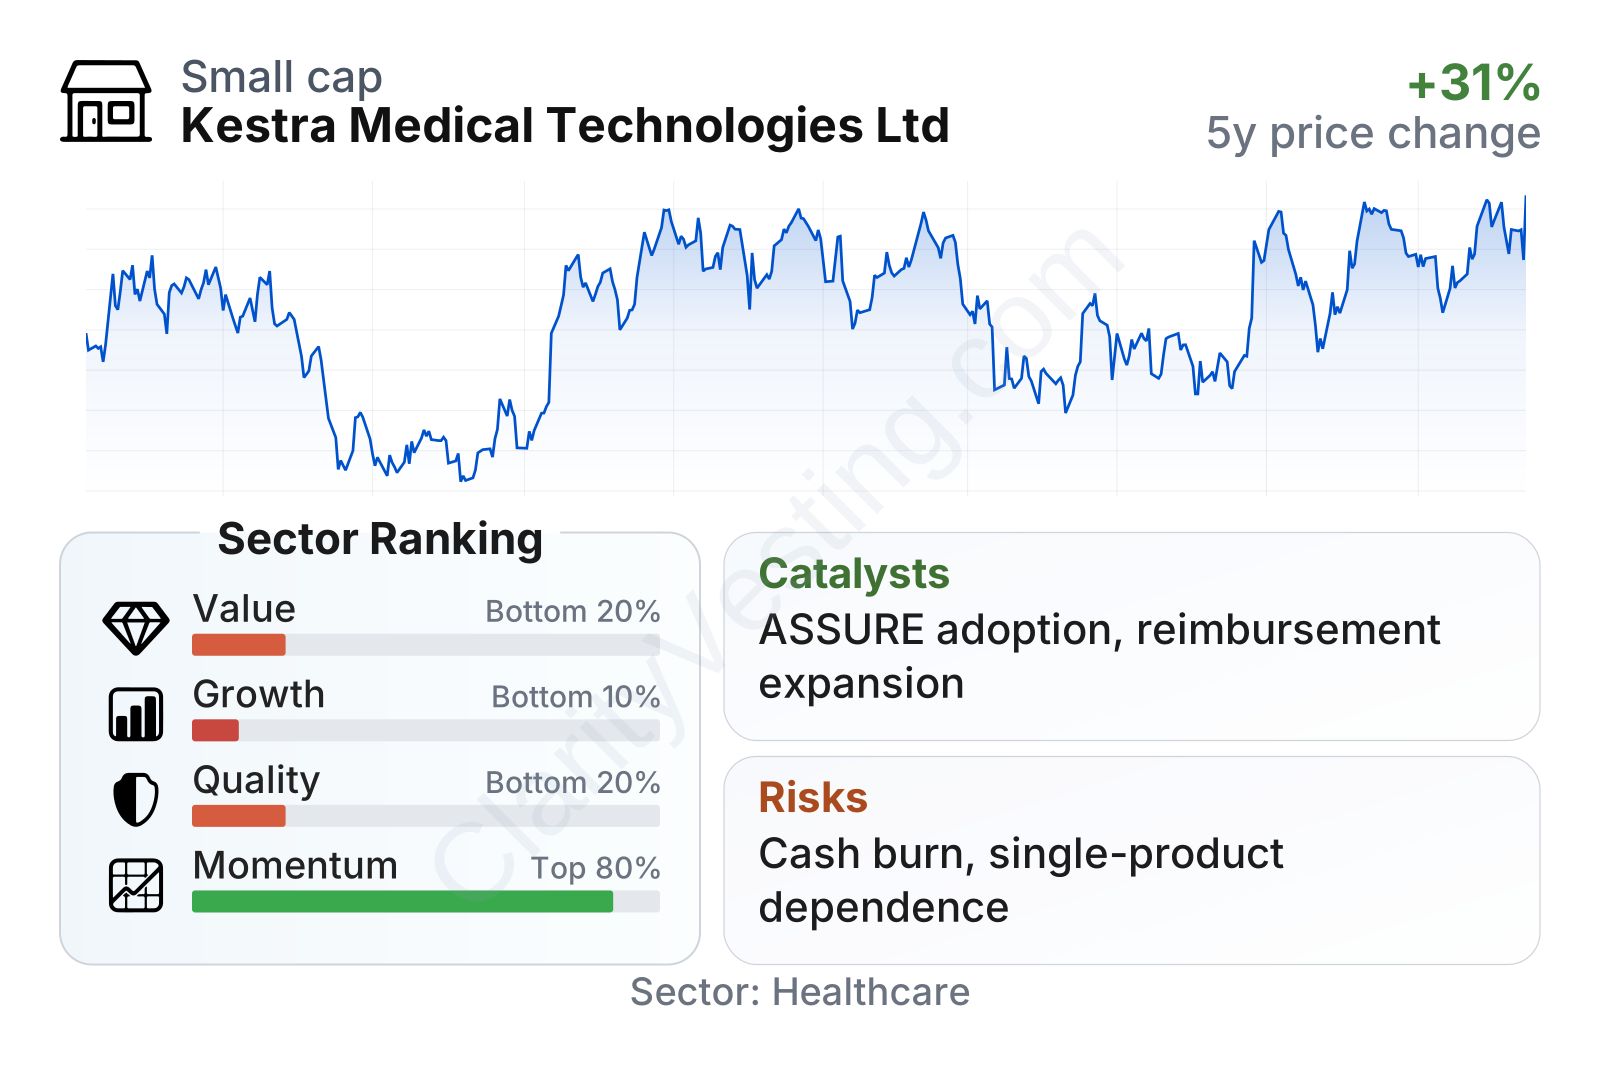
Kestra is still a relatively small public healthcare company, with a market value around the lower end of mid-cap territory. The stock has shown strong recent momentum, with returns over the last six to twelve months well ahead of the sector median. That indicates the market has become more optimistic about the company’s commercial trajectory.
The broader fundamental picture is more mixed. Revenue growth is far above the sector median, but profitability, cash generation, and capital efficiency remain weak. The company ranks in the lower end of the sector on value, quality, and growth factors, largely because losses are still heavy and free cash flow remains deeply negative. Price-to-book is also noticeably above the sector median, which suggests the market is already assigning a premium to future expansion rather than current earnings power.
Growth
Kestra operates in a part of healthcare that has a favorable long-term backdrop. Cardiovascular disease remains a large global health burden, and there is ongoing demand for technologies that can protect at-risk patients after hospitalization or during periods when an implanted device may not yet be appropriate. A wearable defibrillator fits that medical gap. This is not a niche created by fashion or a short product cycle; it serves a serious and recurring clinical need.
The company’s strategy is logical for this stage of development. It is focused on expanding commercial adoption of a single flagship platform, building physician awareness, increasing prescribing activity, and strengthening payer access. If management executes well, this can produce a long runway because adoption in medical devices often builds gradually through hospital systems, cardiology networks, and reimbursement channels.
The recent growth pace has been unusually high. Year-over-year revenue growth has been running around 60%, far above the healthcare sector median of about 7% to 8%. That suggests the product is gaining traction in the field rather than remaining stuck in pilot use. Revenue has risen from roughly $60 million in fiscal 2025 to about $95 million in fiscal 2026, continuing a strong multi-year climb from a very small base.
A major catalyst is the company’s progress in commercialization after regulatory clearance and public listing. As a newer entrant in wearable cardiac protection, Kestra still has room to expand its installed relationships with hospitals and physicians. Public company access to capital can also support broader sales coverage and infrastructure. In addition, any improvement in reimbursement breadth, clinician adoption, or published real-world performance data could materially influence future uptake.
The weak point in the growth picture is cash burn. Free cash flow remains sharply negative, around minus $115 million to minus $120 million on a trailing basis. That means growth is real, but it is currently expensive to produce. For a long-term business case to strengthen, revenue growth eventually needs to translate into operating leverage rather than simply larger absolute losses.
Risks
This article is for informational purposes only and does not constitute financial advice. Some content is AI-generated. See Disclaimer


