Stock Analysis · Kinder Morgan Inc (KMI)
Overview
Kinder Morgan is one of the largest energy infrastructure companies in North America. Rather than mainly producing oil and gas, it earns most of its money by transporting, storing, processing, and handling energy commodities through pipelines, terminals, and related assets. Its network is especially important in natural gas, where the company moves fuel used by utilities, industrial customers, LNG export facilities, and local distribution companies.
The business is organized into several operating segments, with natural gas clearly the largest contributor. Based on the company’s recent reporting structure and earnings mix, the main sources of revenue and operating contribution are approximately the following:
- Natural Gas Pipelines: about 55% to 60% — interstate and intrastate natural gas transportation, storage, gathering, processing, and renewable natural gas activities.
- Products Pipelines: about 15% to 20% — transportation of refined petroleum products, crude oil, condensate, and carbon dioxide-related liquids.
- Terminals: about 15% to 20% — storage and handling of gasoline, diesel, chemicals, metals, petroleum coke, ethanol, and other bulk materials.
- CO2: about 10% to 15% — carbon dioxide transportation and oil production activities tied to enhanced oil recovery.
For long-term analysis, the most important point is that Kinder Morgan’s economics are not driven in the same way as a pure oil producer. A large part of cash flow comes from long-lived infrastructure under contracts, regulated tariffs, or fee-based arrangements. That can make results steadier than those of many commodity-exposed energy companies, although not completely insulated from volume changes, customer health, regulation, and interest costs.
The company’s scale is a major asset. Kinder Morgan operates an enormous pipeline and terminal footprint, and that creates a network effect: once an asset is connected to production fields, utility demand centers, industrial sites, and export markets, it becomes difficult and expensive to replace.
Over the last several years, revenue has moved around more than profit, which is common in midstream because commodity-sensitive pass-through items can distort the top line. What stands out more is the company’s ability to keep net income in a relatively solid range while interest expense remains a meaningful cost, underscoring both the resilience of the asset base and the importance of leverage in the business model.
Key Figures
| Metric | Value | Sector ⓘ |
|---|---|---|
| Date | Oct 24, 2026 | |
| Context | ||
| Sector | Energy | |
| Industry | Oil & Gas Midstream | |
| Market Cap ⓘ | $74.75B | |
| Beta ⓘ | 0.58 | |
Value (Cheapness) | ||
| P/E Ratio ⓘ | 21.52 | 15.40 |
| P/B Ratio ⓘ | 2.49 | 1.71 |
| FCF Yield ⓘ | 4.22% | 8.24% |
| Dividend Yield ⓘ | 3.53% | 3.52% |
| EBIT / EV ⓘ | 5.48% | 7.45% |
| PEG ⓘ | 3.19 | |
Growth (Business expansion) | ||
| Revenue Growth ⓘ | 10.80% | 26.85% |
| RPS Growth (5Y CAGR) ⓘ | 0.97% | 6.78% |
| EPS Growth (5Y CAGR) ⓘ | -7.96% | -14.41% |
| BVPS Growth (5Y CAGR) ⓘ | 0.58% | 6.08% |
| Margin Growth (5Y Trend) ⓘ | 5.40% | 0.55% |
| FCF Growth (5Y CAGR) ⓘ | -10.11% | 2.75% |
| DPS Growth (5Y CAGR) ⓘ | 1.23% | 16.79% |
Quality (Business durability) | ||
| ROIC (Latest) ⓘ | 6.84% | 11.30% |
| ROA (Latest) ⓘ | 4.74% | 6.00% |
| ROIC (5Y Median) ⓘ | 5.30% | 10.35% |
| ROA (5Y Median) ⓘ | 3.67% | 5.46% |
| Net Debt / EBIT (Latest) ⓘ | 5.76 | 1.64 |
| Net Debt / EBIT (5Y Median) ⓘ | 7.63 | 1.82 |
| Net Debt / EBITDA (Latest) ⓘ | 3.99 | 1.08 |
| Net Debt / Assets ⓘ | 43.42% | 17.29% |
| EBITDA / Interest ⓘ | 4.60 | 9.53 |
| Operating Margin (Latest) ⓘ | 31.10% | 16.21% |
| Operating Margin (5Y Median) ⓘ | 27.80% | 20.55% |
| Debt to Equity (Latest) ⓘ | 101.95% | 52.27% |
| Profit Margin (Latest) ⓘ | 19.31% | 8.79% |
| Free Cash Flow (Latest) ⓘ | $3.16B | |
Momentum (Price trend) | ||
| 3Y Return ⓘ | +131.24% | +68.93% |
| 12M Return (excl. last month) ⓘ | +20.32% | +42.90% |
| 6M Return ⓘ | +9.61% | +9.18% |
| Price vs. 200-Day MA ⓘ | +7.89% | +9.87% |
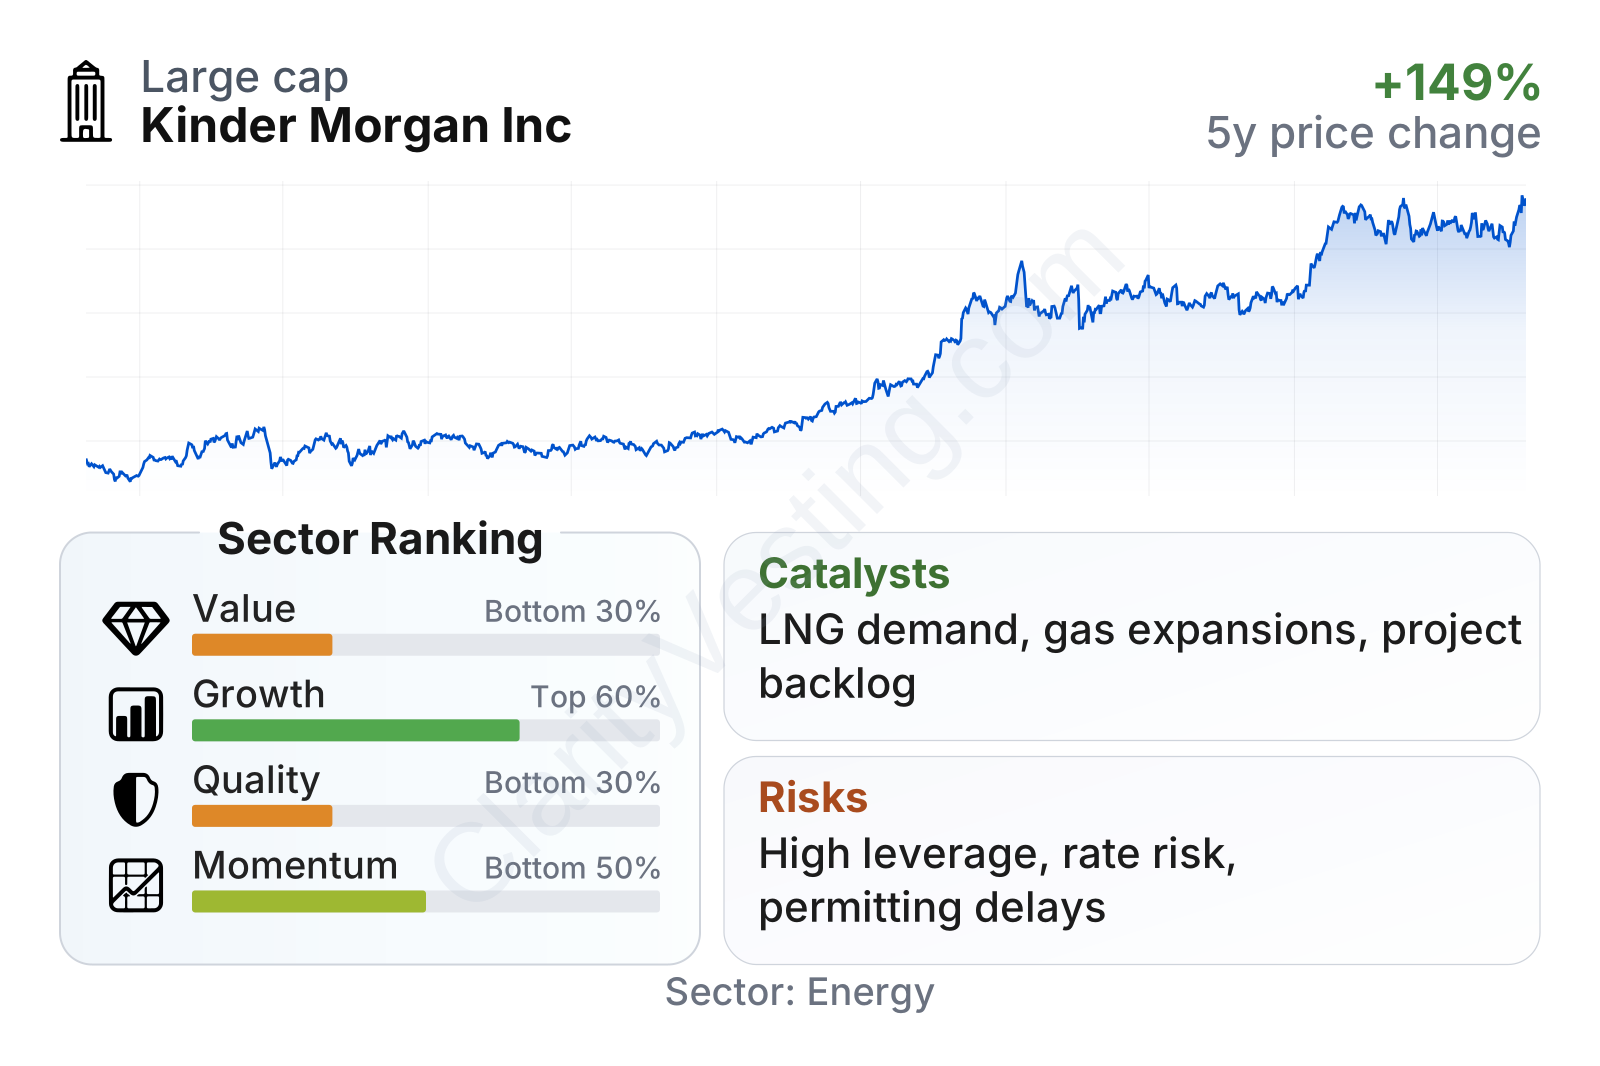
Kinder Morgan is a very large midstream company with a relatively low beta, which fits the profile of a business that tends to trade with less volatility than many energy stocks. The table points to a mixed picture: growth and margins are respectable, but balance-sheet leverage is heavier than the sector median, and valuation metrics are not especially cheap relative to peers. Dividend yield is close to the sector norm, while free cash flow yield and earnings-based valuation measures look less favorable than many energy names.
The share price trend over the last several years has been clearly positive, with a strong move from 2024 into 2026. That appreciation has helped compress the dividend yield from the high-single-digit range earlier in the period to around 4% more recently, which is an important reminder that a stable business can still become less attractively priced after a big rerating.
Growth
Kinder Morgan operates in a part of the energy market that still has long-term relevance. Natural gas remains central to U.S. power generation, industrial use, residential heating, and export demand. Even in a world gradually adding more renewable power, gas infrastructure continues to matter because it supports grid reliability and serves as feedstock for industry and LNG. That does not make the sector high growth in the way software or semiconductors might be, but it does support durable demand for well-positioned pipeline systems.
The company’s strategy is also fairly logical for this backdrop. Kinder Morgan continues to focus on expansion projects tied to natural gas transportation, storage, and connections to major demand centers, including power markets and export-linked infrastructure. This matters because new pipeline projects are hard to replicate due to permitting difficulty, land constraints, and high construction costs. When Kinder Morgan can expand along existing corridors or optimize assets already in place, the returns can be more attractive and execution risk can be lower than building entirely new systems.
Recent revenue growth has improved after a weak stretch in 2023 and a flatter 2024. The latest year-over-year trend is back in positive territory, around low-double-digit percentages, showing the business is participating in a better operating environment. Even so, the pace remains below the sector median, which suggests Kinder Morgan’s appeal depends more on stability and asset quality than on rapid expansion.
Free cash flow has also recovered after a softer period, returning to roughly the upper end of its recent range. That is encouraging because cash generation is central to the Kinder Morgan thesis: it supports dividends, debt management, and capital spending for incremental projects. A business like this does not need explosive revenue growth if it can consistently convert its infrastructure base into dependable cash flow.
A meaningful catalyst is U.S. natural gas demand growth tied to LNG exports, utility demand, and industrial development. Kinder Morgan’s network is positioned to benefit if more gas must move from producing basins to Gulf Coast export facilities and domestic power markets. Another positive factor is the broader need for energy infrastructure serving data center power demand and grid support, which can increase the strategic value of gas transportation assets.
Recent company communications have also emphasized a backlog of expansion projects and continued interest in natural gas infrastructure additions. For a company of this size, growth is more likely to come from a series of medium-sized projects and system expansions than from one transformational breakthrough. That can be less dramatic, but it is often more repeatable.
Risks
This article is for informational purposes only and does not constitute financial advice. Some content is AI-generated. See Disclaimer


