Stock Analysis · Kunlun Energy Co Ltd PK (KLYCY)
Overview
Kunlun Energy Co. Ltd. is a China-focused energy company whose business has gradually shifted away from being mainly an oil and gas producer toward being a natural gas distributor and infrastructure operator. The group is controlled by PetroChina and is best known for supplying natural gas to cities, industrial users, and commercial customers, while also operating liquefied natural gas terminals and related logistics assets. For U.S. readers, KLYCY is the pink-sheet depositary receipt representing this Hong Kong-listed company.
Today, the core of the business is downstream natural gas. That matters for long-term analysis because gas distribution usually brings steadier demand and lower commodity-price sensitivity than upstream oil and gas production, although regulation remains important. In recent years, Kunlun Energy has also had exposure to LNG receiving terminals, pipeline connections, and gas sales linked to China’s ongoing effort to replace coal in heating, industry, and transport with cleaner-burning fuels.
Based on the company’s segment disclosures in recent annual reporting, revenue is dominated by natural gas sales and distribution activities, with a much smaller contribution from other energy-related operations.
- Natural gas sales, distribution, and related infrastructure: approximately 90% to 95% of revenue. This includes city-gas retail sales, wholesale gas trading, pipeline delivery, LNG terminal services, and related customer connections.
- LPG, LNG processing, and other energy-related activities: approximately 5% to 10% of revenue. This is the smaller part of the portfolio and can include ancillary processing, logistics, and remaining non-core activities.
The broad financial pattern over the last several years shows a company with rising revenue, but with margins that remain modest for an energy business. Sales moved upward from roughly 139 billion to nearly 189 billion in the period shown, while operating profit and net income did not rise at the same pace. That suggests volume growth and a larger gas platform, but also pressure from procurement costs and regulated pricing dynamics.
The visual breakdown also points to a business where revenue has expanded over time, but profitability has not widened in parallel. Cost of revenue absorbs most of sales, which is typical for a gas distributor and marketer rather than a high-margin producer.
Key Figures
| Metric | Value | Sector ⓘ |
|---|---|---|
| Date | Oct 17, 2026 | |
| Context | ||
| Sector | Energy | |
| Industry | Oil & Gas Refining & Marketing | |
| Market Cap ⓘ | $8.45B | |
| Beta ⓘ | 0.56 | |
Value (Cheapness) | ||
| P/E Ratio ⓘ | 10.77 | 15.44 |
| P/B Ratio ⓘ | 0.12 | 1.73 |
| FCF Yield ⓘ | 188.11% | 8.20% |
| Dividend Yield ⓘ | 5.10% | 3.59% |
| EBIT / EV ⓘ | N/A | 7.46% |
| PEG ⓘ | N/A | |
Growth (Business expansion) | ||
| Revenue Growth ⓘ | 2.60% | 26.90% |
| RPS Growth (5Y CAGR) ⓘ | 8.03% | 6.90% |
| EPS Growth (5Y CAGR) ⓘ | N/A | -15.73% |
| BVPS Growth (5Y CAGR) ⓘ | -6.35% | 6.07% |
| Margin Growth (5Y Trend) ⓘ | -3.06% | 0.58% |
| FCF Growth (5Y CAGR) ⓘ | 15.60% | 1.86% |
| DPS Growth (5Y CAGR) ⓘ | -39.76% | 16.79% |
Quality (Business durability) | ||
| ROIC (Latest) ⓘ | N/A | 11.40% |
| ROA (Latest) ⓘ | 7.77% | 6.06% |
| ROIC (5Y Median) ⓘ | 10.68% | 10.30% |
| ROA (5Y Median) ⓘ | 4.02% | 5.42% |
| Net Debt / EBIT (Latest) ⓘ | -0.83 | 1.64 |
| Net Debt / EBIT (5Y Median) ⓘ | -0.26 | 1.83 |
| Net Debt / EBITDA (Latest) ⓘ | -0.57 | 1.08 |
| Net Debt / Assets ⓘ | -12.81% | 17.29% |
| EBITDA / Interest ⓘ | N/A | 9.64 |
| Operating Margin (Latest) ⓘ | 5.85% | 16.27% |
| Operating Margin (5Y Median) ⓘ | 7.18% | 20.39% |
| Debt to Equity (Latest) ⓘ | 30.70% | 54.76% |
| Profit Margin (Latest) ⓘ | 2.80% | 8.82% |
| Free Cash Flow (Latest) ⓘ | $15.89B | |
Momentum (Price trend) | ||
| 3Y Return ⓘ | +33.24% | +67.38% |
| 12M Return (excl. last month) ⓘ | +5.37% | +49.19% |
| 6M Return ⓘ | +9.99% | +7.07% |
| Price vs. 200-Day MA ⓘ | +9.81% | +9.56% |
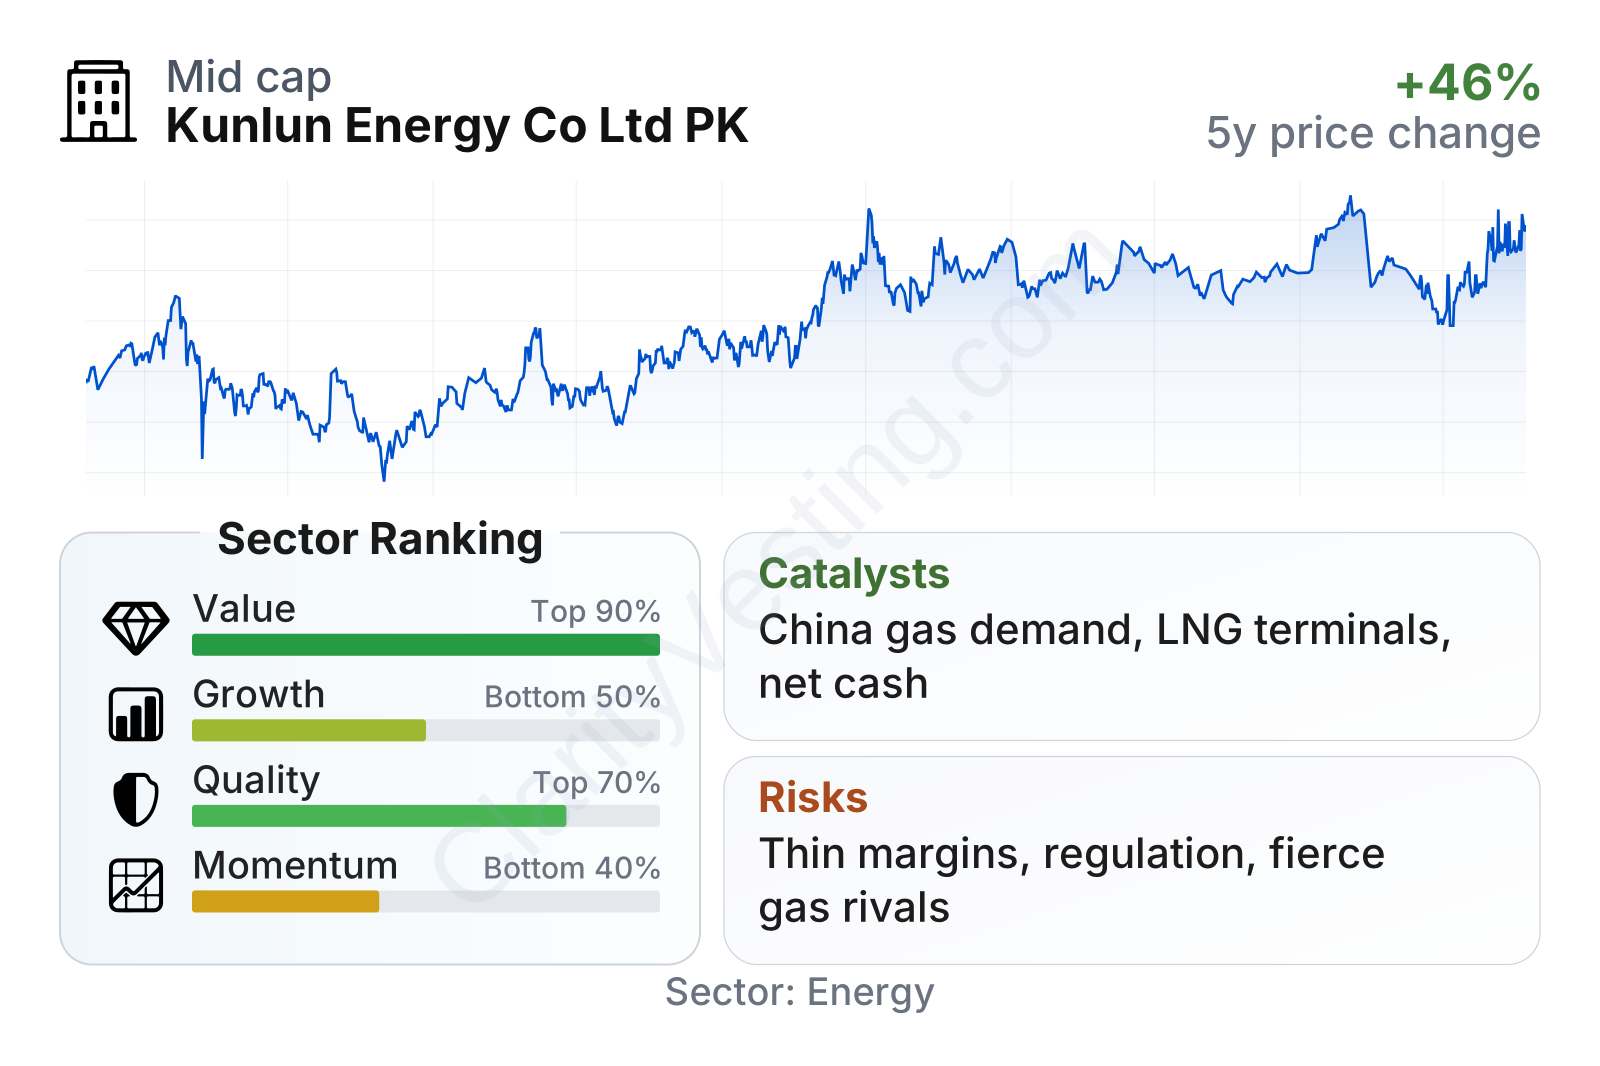
Kunlun Energy sits in the large-cap range among pink-sheet energy names and has shown relatively low share-price volatility, with a beta around 0.56. The valuation profile looks notably inexpensive versus the sector on several measures: earnings multiple is below the sector median, price-to-book is extremely low, free-cash-flow yield is strong, and the trailing dividend yield is above the sector median.
Quality is more mixed. The balance sheet appears conservative, with net cash rather than net debt on several leverage measures and debt-to-equity near 31%, clearly below the sector median. Return on assets is also slightly better than the sector median. However, operating and profit margins are materially lower than many energy peers, which reflects the economics of gas distribution and trading.
Growth indicators are less impressive in the short term. Year-over-year revenue growth is modest, and margin trends over five years have softened. Longer-term revenue-per-share growth and free-cash-flow growth are better than the sector median, but the company does not currently look like a fast-growing energy name. Price momentum also trails much of the sector, with the stock having delivered a steadier but less forceful move than many energy peers over the last one to three years.
Growth
Kunlun Energy operates in a part of the energy market that still has structural room to grow. In China, natural gas continues to play an important role in the transition away from heavier-emission fuels such as coal, especially for urban heating, industrial energy use, distributed power, and transport applications. Gas is not growing with the same excitement as some renewable themes, but it remains a practical bridge fuel in a very large market.
The company’s strategy generally makes industrial sense. A downstream gas platform tends to be more stable than pure commodity extraction because it is linked to recurring demand from households, businesses, and municipalities. LNG terminals and pipeline connections can strengthen that position by giving the group physical access to supply and by embedding it deeper into regional gas networks. This kind of asset base can create a durable operating footprint, even if it does not always produce high margins.
A meaningful catalyst is continued expansion of gas penetration in China’s cities and industrial clusters. New customer connections, higher per-customer gas consumption, and broader LNG import and regasification utilization can all support volume growth. Another positive element is the company’s financial position: the balance sheet and cash generation give it room to keep investing in network expansion, terminal capacity, and customer development without appearing heavily stretched.
Recent corporate reporting has also reinforced the idea of Kunlun Energy as a cleaner-fuel infrastructure operator rather than a conventional exploration-led energy company. That transition can be strategically useful over the long run because regulated and contracted gas demand often carries better visibility than upstream earnings tied directly to oil and gas price swings.
Risks
This article is for informational purposes only and does not constitute financial advice. Some content is AI-generated. See Disclaimer


