Stock Analysis · KKR & Co. Inc (KKR)
Overview
KKR & Co. Inc. is a global alternative asset manager. In simple terms, it raises money from institutions, wealthy individuals, and other clients, then invests that capital across private equity, credit, infrastructure, real estate, and insurance-related strategies. It also earns income from investments made with its own balance sheet. The business is built around managing other people’s money for fees, while also participating in the upside when investments perform well.
Its revenue mix can move meaningfully from year to year because performance fees, investment gains, and insurance-related earnings are sensitive to market conditions, realizations, and valuation changes. Still, KKR’s structure is fairly clear: recurring management fees provide the base, while performance income and investment income create more upside but also more volatility.
Based on the company’s recent reporting structure and business mix, the main economic sources of revenue can be summarized as follows:
- Asset management fees: approximately 35% to 45% of total revenue in a more normalized period. These are recurring fees earned for managing private equity, credit, infrastructure, real estate, and related funds.
- Insurance-related earnings: approximately 20% to 30%. This reflects KKR’s insurance platform, centered on Global Atlantic, where spread-based earnings and investment management activity add a large and increasingly recurring stream.
- Performance income and carried interest: approximately 15% to 30%. This includes incentive income tied to strong fund performance and asset sales. It can be very strong in favorable markets and much lower in weaker years.
- Balance sheet and principal investment income: approximately 10% to 20%. This comes from KKR investing its own capital alongside clients and earning returns from those holdings.
That combination matters for long-term analysis. KKR is no longer just a classic private equity firm. It has become a broader asset manager with a large insurance arm and meaningful exposure to private credit, infrastructure, and real assets. This diversification can reduce dependence on any one fund cycle, although earnings still remain more variable than those of a traditional fee-only asset manager.
The business has scaled sharply over the last several years, with revenue and operating income rising substantially from earlier levels, but the path has not been smooth. Earnings power can swing with realizations, valuation marks, and financing costs, which is normal for this type of company.
Key Figures
| Metric | Value | Sector ⓘ |
|---|---|---|
| Date | Oct 17, 2026 | |
| Context | ||
| Sector | Financial Services | |
| Industry | Asset Management | |
| Market Cap ⓘ | $79.06B | |
| Beta ⓘ | 1.83 | |
Value (Cheapness) | ||
| P/E Ratio ⓘ | 27.88 | 12.26 |
| P/B Ratio ⓘ | 2.94 | 1.23 |
| FCF Yield ⓘ | 2.96% | 10.40% |
| Dividend Yield ⓘ | 0.87% | 3.02% |
| EBIT / EV ⓘ | 83.01% | 8.14% |
| PEG ⓘ | 0.41 | |
Growth (Business expansion) | ||
| Revenue Growth ⓘ | 7.80% | 9.35% |
| RPS Growth (5Y CAGR) ⓘ | -5.72% | 12.19% |
| EPS Growth (5Y CAGR) ⓘ | -7.86% | -9.53% |
| BVPS Growth (5Y CAGR) ⓘ | -14.00% | 4.99% |
| Margin Growth (5Y Trend) ⓘ | 45.96% | -3.86% |
| FCF Growth (5Y CAGR) ⓘ | N/A | 4.81% |
| DPS Growth (5Y CAGR) ⓘ | 4.95% | 8.79% |
Quality (Business durability) | ||
| ROIC (Latest) ⓘ | 8.10% | 9.49% |
| ROE (Latest) ⓘ | 10.10% | 13.90% |
| ROA (Latest) ⓘ | 0.78% | 1.55% |
| ROIC (5Y Median) ⓘ | 11.32% | 7.86% |
| ROE (5Y Median) ⓘ | 13.23% | 12.17% |
| ROA (5Y Median) ⓘ | 0.91% | 1.30% |
| Net Debt / EBIT (Latest) ⓘ | 4.91 | 0.96 |
| Net Debt / EBIT (5Y Median) ⓘ | 3.81 | 0.73 |
| Net Debt / EBITDA (Latest) ⓘ | 4.11 | 0.92 |
| Operating Margin (Latest) ⓘ | 38.70% | 22.30% |
| Operating Margin (5Y Median) ⓘ | 52.95% | 24.63% |
| Debt to Equity (Latest) ⓘ | 162.63% | 58.56% |
| Profit Margin (Latest) ⓘ | 12.20% | 26.57% |
| Free Cash Flow (Latest) ⓘ | $2.34B | |
Momentum (Price trend) | ||
| 3Y Return ⓘ | +48.17% | +88.33% |
| 12M Return (excl. last month) ⓘ | -30.37% | +19.38% |
| 6M Return ⓘ | -15.29% | +4.75% |
| Price vs. 200-Day MA ⓘ | -13.07% | +3.50% |
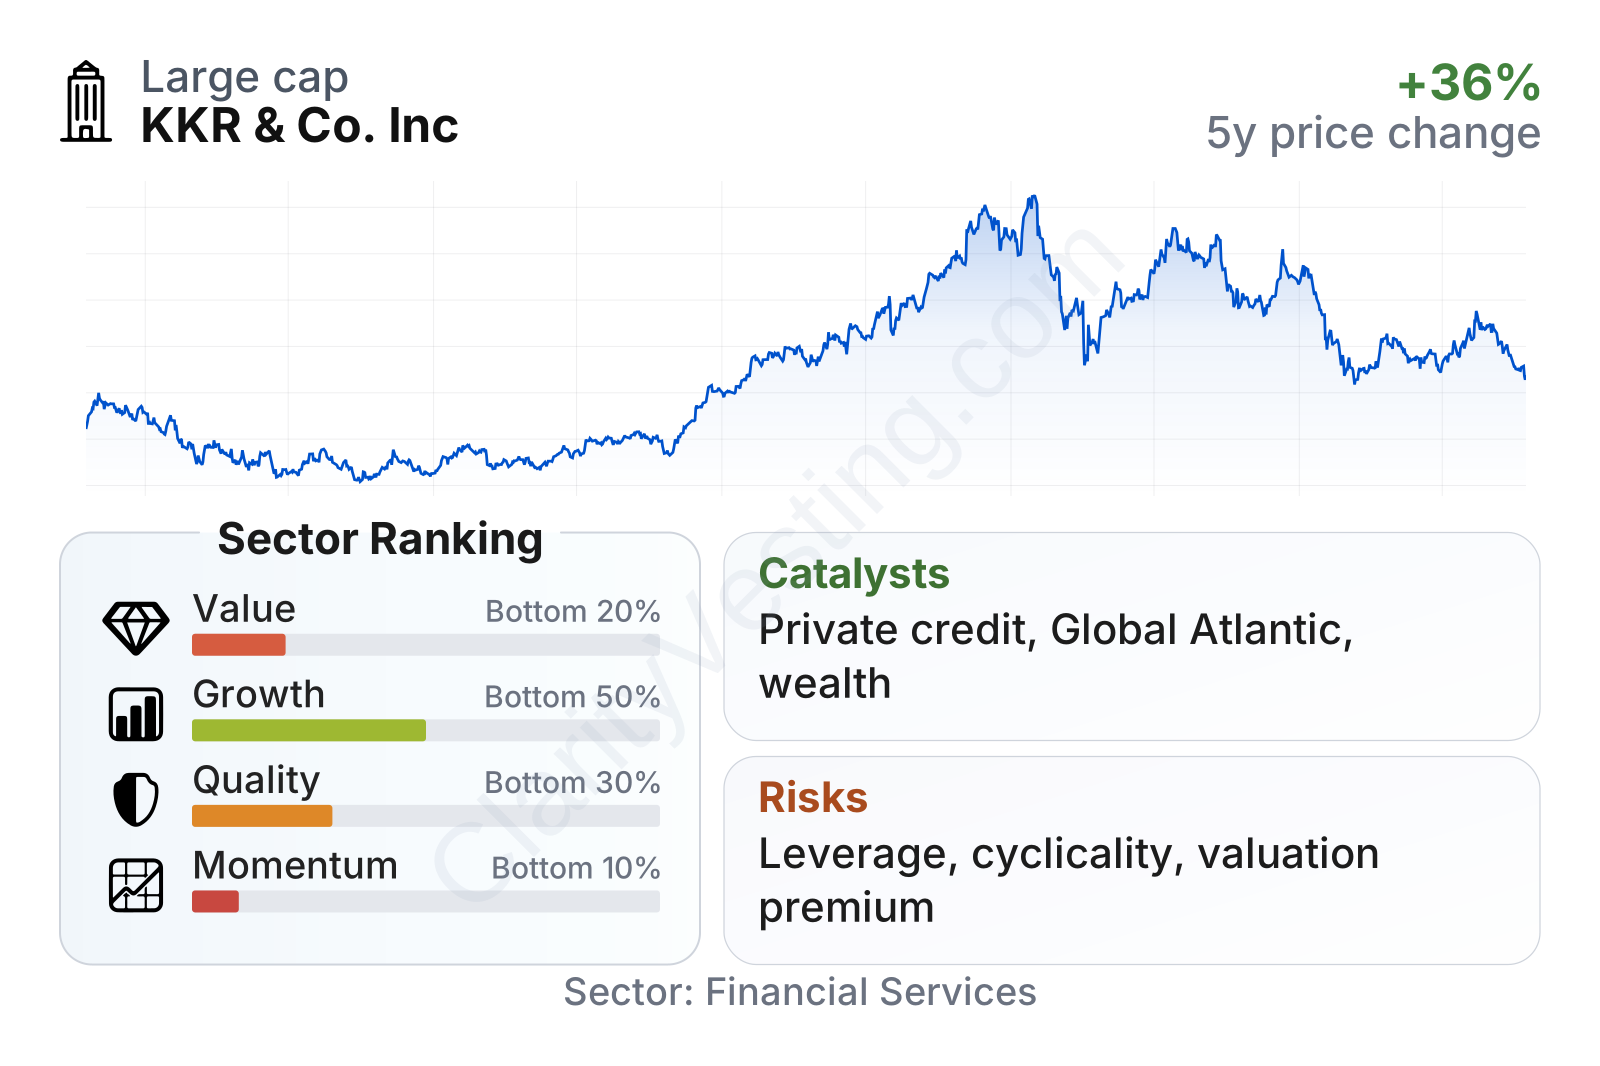
KKR is a very large company in asset management, but the current metric profile is mixed. Growth characteristics are around the middle of the sector, while quality, value, and recent price momentum rank weaker. Profitability at the operating level remains strong, yet leverage is clearly higher than the sector median, and valuation multiples sit above many financial peers. The stock has also been notably more volatile than the average financial stock, which fits the business model and the higher beta.
The share price history shows both strong long-term appreciation and sharp drawdowns. That is also consistent with KKR’s model: when private markets, credit conditions, and fundraising are favorable, the market can reward the company quickly; when sentiment weakens, the stock can reset just as fast.
Growth
KKR operates in one of the more attractive corners of financial services: alternative assets. Large pension funds, sovereign funds, insurers, and wealthy clients continue to increase allocations to private markets in search of higher returns, income, and diversification. That broad shift supports long-term demand for private equity, private credit, infrastructure, and asset-based finance. Among these areas, private credit and insurance-linked investing appear especially important for KKR’s next phase.
The company’s strategy makes sense for future expansion because it is no longer relying on a single engine. Fundraising across multiple asset classes, monetization of older private equity investments, and the scaling of the insurance platform all create separate avenues for growth. Global Atlantic is particularly important because insurance assets can provide long-duration capital and recurring spread earnings, making part of KKR’s model steadier than a pure transaction-driven private equity business.
Another support is product breadth. KKR has built capabilities in areas where institutional demand has remained durable, including infrastructure, energy transition, strategic holdings, credit, and real estate debt. This matters because large clients increasingly prefer managers that can offer many strategies under one umbrella.
Earnings per share have been uneven rather than linear, which is normal for an alternative manager. After weakening through 2023, EPS improved in 2024 and 2025. That pattern suggests underlying earnings capacity has grown, but reported results still depend on timing of exits, market marks, and financing conditions. For long-term readers, the key point is not smooth annual progression, but whether fee-related earnings and insurance earnings are becoming a larger share of the whole.
Book value per share has also improved, especially after the earlier period of balance sheet distortion. That indicates that capital accumulation and retained earnings have generally moved in the right direction, even if accounting results can look noisy from year to year.
A recent and important opportunity is KKR’s continued push into private credit and asset-based finance, areas where banks have been more constrained by regulation and capital requirements. This opens room for non-bank lenders with scale, distribution, underwriting expertise, and long-term capital. KKR fits that profile. The company has also continued broadening access to alternative investments through wealth channels, which could enlarge its addressable market beyond institutional clients over time.
Risks
This article is for informational purposes only and does not constitute financial advice. Some content is AI-generated. See Disclaimer


