Stock Analysis · Kimco Realty Corporation (KIM)
Overview
Kimco Realty Corporation is a retail real estate investment trust, or REIT. In simple terms, it owns and operates shopping centers and mixed-use properties, then collects rent from the businesses that occupy those spaces. Its portfolio is concentrated in open-air, grocery-anchored centers in major U.S. metropolitan markets. That matters because necessity-based retail, especially supermarkets, pharmacies, fitness, discount retail, and everyday services, tends to be more resilient than discretionary retail during weaker economic periods.
The company’s business model is straightforward: acquire, develop, redevelop, lease, and manage retail properties in densely populated trade areas. Kimco has also been expanding selected mixed-use projects that add apartments or other uses around its retail centers, aiming to increase traffic and land productivity at existing sites rather than relying only on new acquisitions.
Based on recent company filings, Kimco’s revenue comes mainly from recurring property income, with smaller contributions from other real estate activities. The mix can vary somewhat by quarter, but it is broadly driven by the following sources:
- Rental property revenues: roughly 85% to 90% — base rent from tenants, reimbursements for common area maintenance, real estate taxes, and other property-related charges.
- Ancillary property income and management-related items: roughly 5% to 10% — parking, temporary leasing, signage, and other center-level income streams.
- Other real estate and investment-related income: generally less than 10% — gains, fee income, or income tied to joint ventures, redevelopment, and occasional property transactions.
What stands out is that Kimco is not dependent on a single tenant category in the same way a mall landlord might be. Its revenue is spread across many retailers and service businesses, with grocery anchors acting as traffic drivers for the rest of the center.
Over the last several years, revenue has trended upward, but profitability has been more uneven because interest expense and property-level costs have also risen. Even so, operating income remains substantial, which is typical for a large retail REIT with a mature portfolio.
Key Figures
| Metric | Value | Sector ⓘ |
|---|---|---|
| Date | Oct 24, 2026 | |
| Context | ||
| Sector | Real Estate | |
| Industry | REIT - Retail | |
| Market Cap ⓘ | $15.24B | |
| Beta ⓘ | 0.96 | |
Value (Cheapness) | ||
| P/E Ratio ⓘ | 26.73 | 17.85 |
| P/B Ratio ⓘ | 1.57 | 0.87 |
| FCF Yield ⓘ | 5.63% | 7.30% |
| Dividend Yield ⓘ | 4.48% | 4.83% |
| EBIT / EV ⓘ | 4.09% | 3.78% |
| PEG ⓘ | 3.37 | |
Growth (Business expansion) | ||
| Revenue Growth ⓘ | 4.90% | 5.35% |
| RPS Growth (5Y CAGR) ⓘ | 4.44% | 6.02% |
| EPS Growth (5Y CAGR) ⓘ | -1.16% | -10.65% |
| BVPS Growth (5Y CAGR) ⓘ | -5.97% | 0.43% |
| Margin Growth (5Y Trend) ⓘ | -22.69% | -0.69% |
| FCF Growth (5Y CAGR) ⓘ | 17.73% | 5.40% |
| DPS Growth (5Y CAGR) ⓘ | 9.13% | 5.07% |
Quality (Business durability) | ||
| ROIC (Latest) ⓘ | 5.07% | 5.69% |
| ROE (Latest) ⓘ | 5.79% | 7.37% |
| ROA (Latest) ⓘ | 3.04% | 2.85% |
| ROIC (5Y Median) ⓘ | 4.84% | 4.26% |
| ROE (5Y Median) ⓘ | 5.33% | 6.04% |
| ROA (5Y Median) ⓘ | 2.92% | 2.45% |
| Net Debt / EBIT (Latest) ⓘ | 8.45 | 7.55 |
| Net Debt / EBIT (5Y Median) ⓘ | 8.40 | 8.26 |
| Net Debt / EBITDA (Latest) ⓘ | 5.12 | 5.26 |
| Net Debt / Assets ⓘ | 40.13% | 37.45% |
| EBITDA / Interest ⓘ | 3.80 | 4.11 |
| Operating Margin (Latest) ⓘ | 43.49% | 33.86% |
| Operating Margin (5Y Median) ⓘ | 46.87% | 37.49% |
| Debt to Equity (Latest) ⓘ | 85.14% | 88.76% |
| Profit Margin (Latest) ⓘ | 27.76% | 18.94% |
| Free Cash Flow (Latest) ⓘ | $857.45M | |
Momentum (Price trend) | ||
| 3Y Return ⓘ | +65.10% | +36.33% |
| 12M Return (excl. last month) ⓘ | +8.53% | +4.32% |
| 6M Return ⓘ | +2.38% | -1.74% |
| Price vs. 200-Day MA ⓘ | +2.44% | -1.42% |
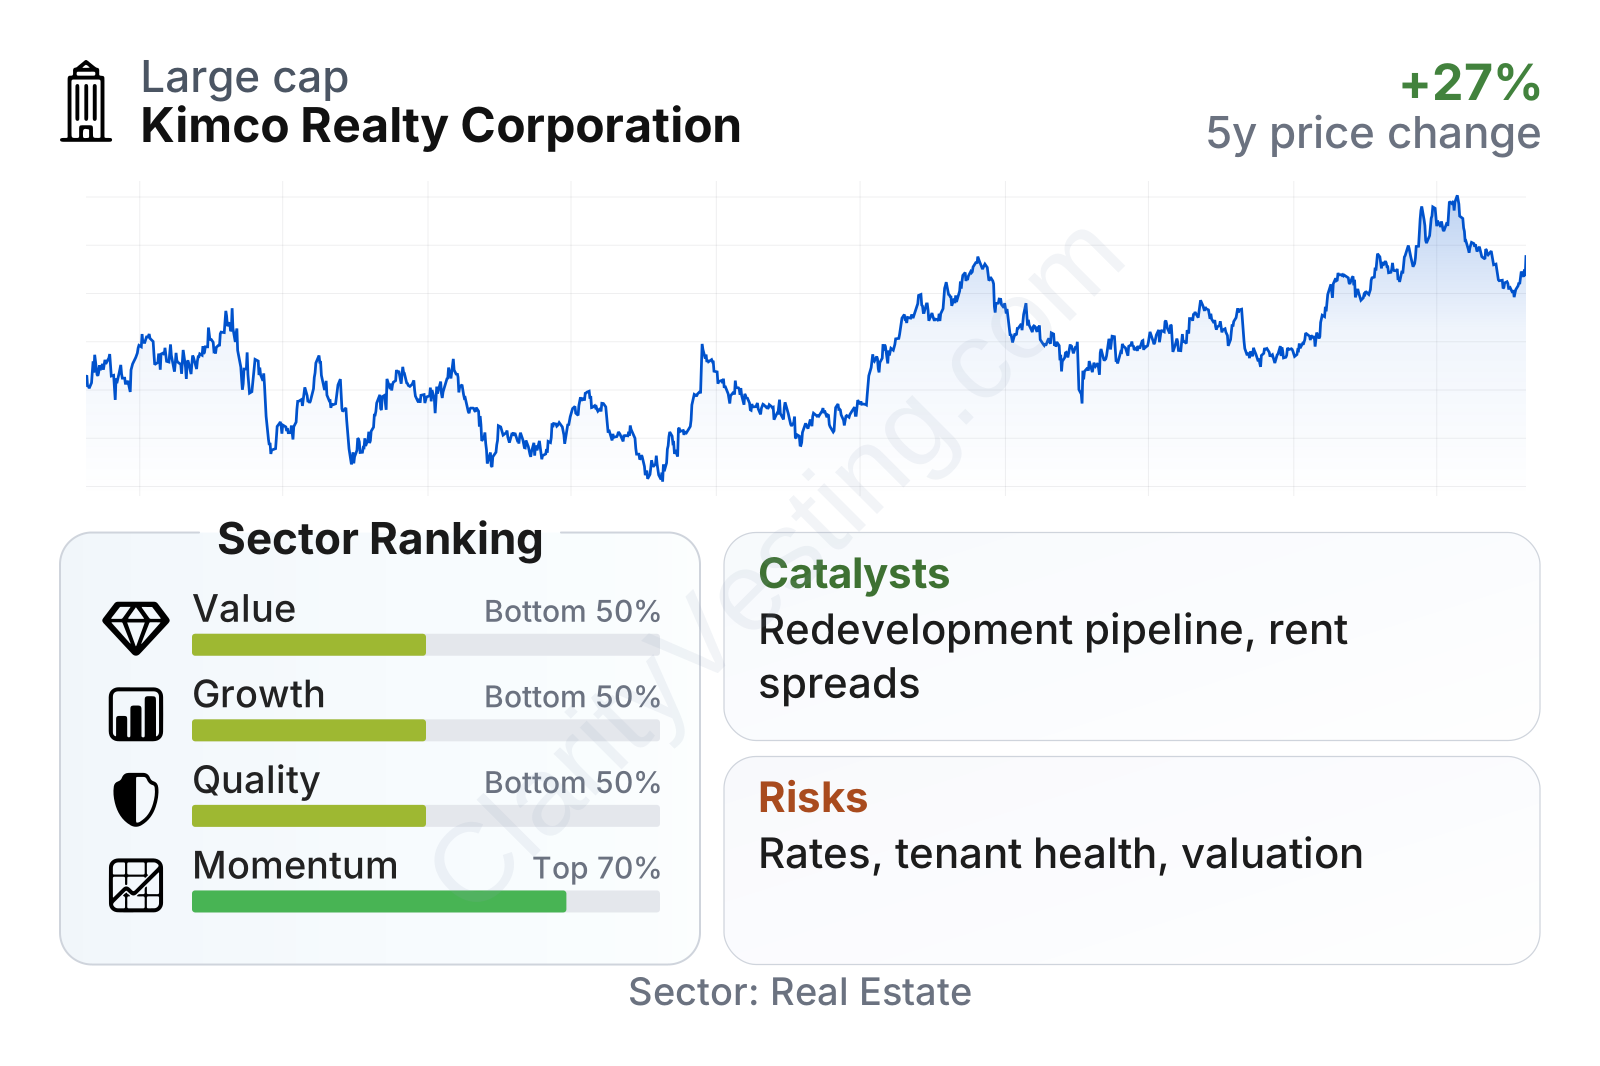
Kimco is a large public retail REIT with a stock volatility close to the broader market. The current metric mix points to a company that looks stronger on cash generation and operating profitability than on headline growth or traditional value screens. Relative to many real estate peers, momentum has been decent, but valuation measures such as earnings and book multiples are no longer especially cheap.
Profitability is mixed in an interesting way. Operating margin and profit margin are healthy for the sector, and return on assets is slightly above the sector median, but return on equity and return on invested capital are not standout figures. Growth also looks uneven: revenue has been rising at a modest pace, while free cash flow and dividends have improved more strongly than accounting earnings.
Growth
Kimco operates in a part of real estate that is more stable than many people assume. Open-air shopping centers focused on everyday needs have held up better than enclosed malls, and they remain relevant even in an e-commerce world because groceries, restaurants, fitness, health services, pet care, and discount retail are difficult to replace entirely online. That does not make the sector high growth, but it does support steady occupancy, rent collections, and redevelopment opportunities.
The company’s strategy is sensible for long-term expansion. Instead of chasing aggressive portfolio growth, Kimco has focused on high-quality suburban and first-ring urban locations, especially centers anchored by strong grocers. It is also using redevelopment and mixed-use intensification to extract more value from land it already owns. That can be attractive because redeveloping an existing center is often less risky than building a large new project from scratch, particularly in supply-constrained markets.
Revenue per share has shown a steady upward trend over the last five years, which is one of the cleaner signs that growth has not come only from financial engineering. The pace is moderate rather than rapid, but it supports the idea that Kimco has been improving the earning capacity of its portfolio over time.
Dividend per share has also increased meaningfully over the same period, although not in a perfectly straight line. That pattern fits a REIT that has been rebuilding and then growing its payout while balancing debt costs and redevelopment spending. For a real estate company, rising distributions alongside rising free cash flow is usually more informative than earnings per share alone.
A notable long-term catalyst is the company’s redevelopment pipeline and mixed-use projects around existing shopping centers. Adding residential units or reconfiguring space for stronger tenants can lift rent per square foot and make the properties more productive. Another potential tailwind is any easing in interest rates, which could support property values, lower financing pressure, and improve acquisition economics across the REIT sector.
Recent company updates have continued to emphasize leasing demand, occupancy improvement, redevelopment execution, and portfolio quality. None of that suggests a dramatic one-time breakthrough, but it does support a credible path to gradual internal growth, which is often the most durable kind in real estate.
Risks
This article is for informational purposes only and does not constitute financial advice. Some content is AI-generated. See Disclaimer


