Stock Analysis · Kinross Gold Corporation (KGC)
Overview
Kinross Gold Corporation is a large gold mining company that explores for, develops, and operates mines. Its business is straightforward: it spends capital to find and build mining assets, extracts ore, processes it, and sells the resulting gold. The company also produces a smaller amount of silver as a by-product. Kinross operates across the Americas and West Africa, with producing mines and development projects that give it exposure to both current cash generation and future reserve replacement.
For long-term analysis, Kinross is best understood as a gold producer whose results depend mainly on three things: the gold price, the amount of gold it can produce, and how efficiently it can run its mines. In recent years, the company has been reshaping its portfolio toward mines with longer lives, lower political complexity than some past assets, and stronger free cash flow generation.
Its revenue is heavily concentrated in gold sales, with silver providing only a modest contribution. Based on company disclosures, the revenue mix can be summarized as follows:
- Gold sales: about 95% to 98% of total revenue. This includes doré and other gold output sold from producing mines across the portfolio.
- Silver sales and other by-products: about 2% to 5% of total revenue. This mainly reflects silver recovered alongside gold production, plus limited other mining-related revenue.
Geographically, Kinross is diversified, but not evenly. Revenue is tied to the production profile of its main mines, especially assets in the United States, Brazil, Mauritania, and Chile. That matters because mine-specific performance can have a visible effect on group results.
Over the last several years, the business has become meaningfully more profitable. Revenue rose from about $2.6 billion in 2021 to more than $7 billion in 2025, while operating income and net income expanded much faster than sales. That points to more than just higher gold prices: it also suggests stronger mine execution and operating leverage.
The financial flow shows a clear improvement in scale and profitability since 2023. Sales have increased strongly, operating costs have grown more slowly, and a much larger share of revenue is now reaching operating income and net income than a few years ago.
Key Figures
| Metric | Value | Sector ⓘ |
|---|---|---|
| Date | Oct 17, 2026 | |
| Context | ||
| Sector | Basic Materials | |
| Industry | Gold | |
| Market Cap ⓘ | $27.81B | |
| Beta ⓘ | 1.52 | |
Value (Cheapness) | ||
| P/E Ratio ⓘ | 8.95 | 16.90 |
| P/B Ratio ⓘ | 2.79 | 1.65 |
| FCF Yield ⓘ | 11.08% | 5.76% |
| Dividend Yield ⓘ | 0.66% | 2.13% |
| EBIT / EV ⓘ | 13.77% | 6.30% |
| PEG ⓘ | 1.12 | |
Growth (Business expansion) | ||
| Revenue Growth ⓘ | 29.50% | 11.10% |
| RPS Growth (5Y CAGR) ⓘ | 30.05% | 4.49% |
| EPS Growth (5Y CAGR) ⓘ | 62.53% | -13.47% |
| BVPS Growth (5Y CAGR) ⓘ | 7.42% | 5.51% |
| Margin Growth (5Y Trend) ⓘ | 40.47% | -1.54% |
| FCF Growth (5Y CAGR) ⓘ | 104.93% | 0.37% |
| DPS Growth (5Y CAGR) ⓘ | 1.06% | 6.08% |
Quality (Business durability) | ||
| ROIC (Latest) ⓘ | 33.39% | 9.26% |
| ROA (Latest) ⓘ | 24.54% | 4.91% |
| ROIC (5Y Median) ⓘ | 5.45% | 7.70% |
| ROA (5Y Median) ⓘ | 3.99% | 3.86% |
| Net Debt / EBIT (Latest) ⓘ | -0.43 | 1.40 |
| Net Debt / EBIT (5Y Median) ⓘ | 2.43 | 1.70 |
| Net Debt / EBITDA (Latest) ⓘ | -0.35 | 0.95 |
| Net Debt / Assets ⓘ | -14.22% | 13.69% |
| EBITDA / Interest ⓘ | 101.92 | 12.34 |
| Operating Margin (Latest) ⓘ | 52.91% | 13.20% |
| Operating Margin (5Y Median) ⓘ | 18.34% | 11.80% |
| Debt to Equity (Latest) ⓘ | 7.65% | 40.56% |
| Profit Margin (Latest) ⓘ | 37.52% | 6.43% |
| Free Cash Flow (Latest) ⓘ | $3.08B | |
Momentum (Price trend) | ||
| 3Y Return ⓘ | +348.64% | +68.89% |
| 12M Return (excl. last month) ⓘ | +21.69% | +30.21% |
| 6M Return ⓘ | -34.43% | -4.16% |
| Price vs. 200-Day MA ⓘ | -23.83% | -1.27% |
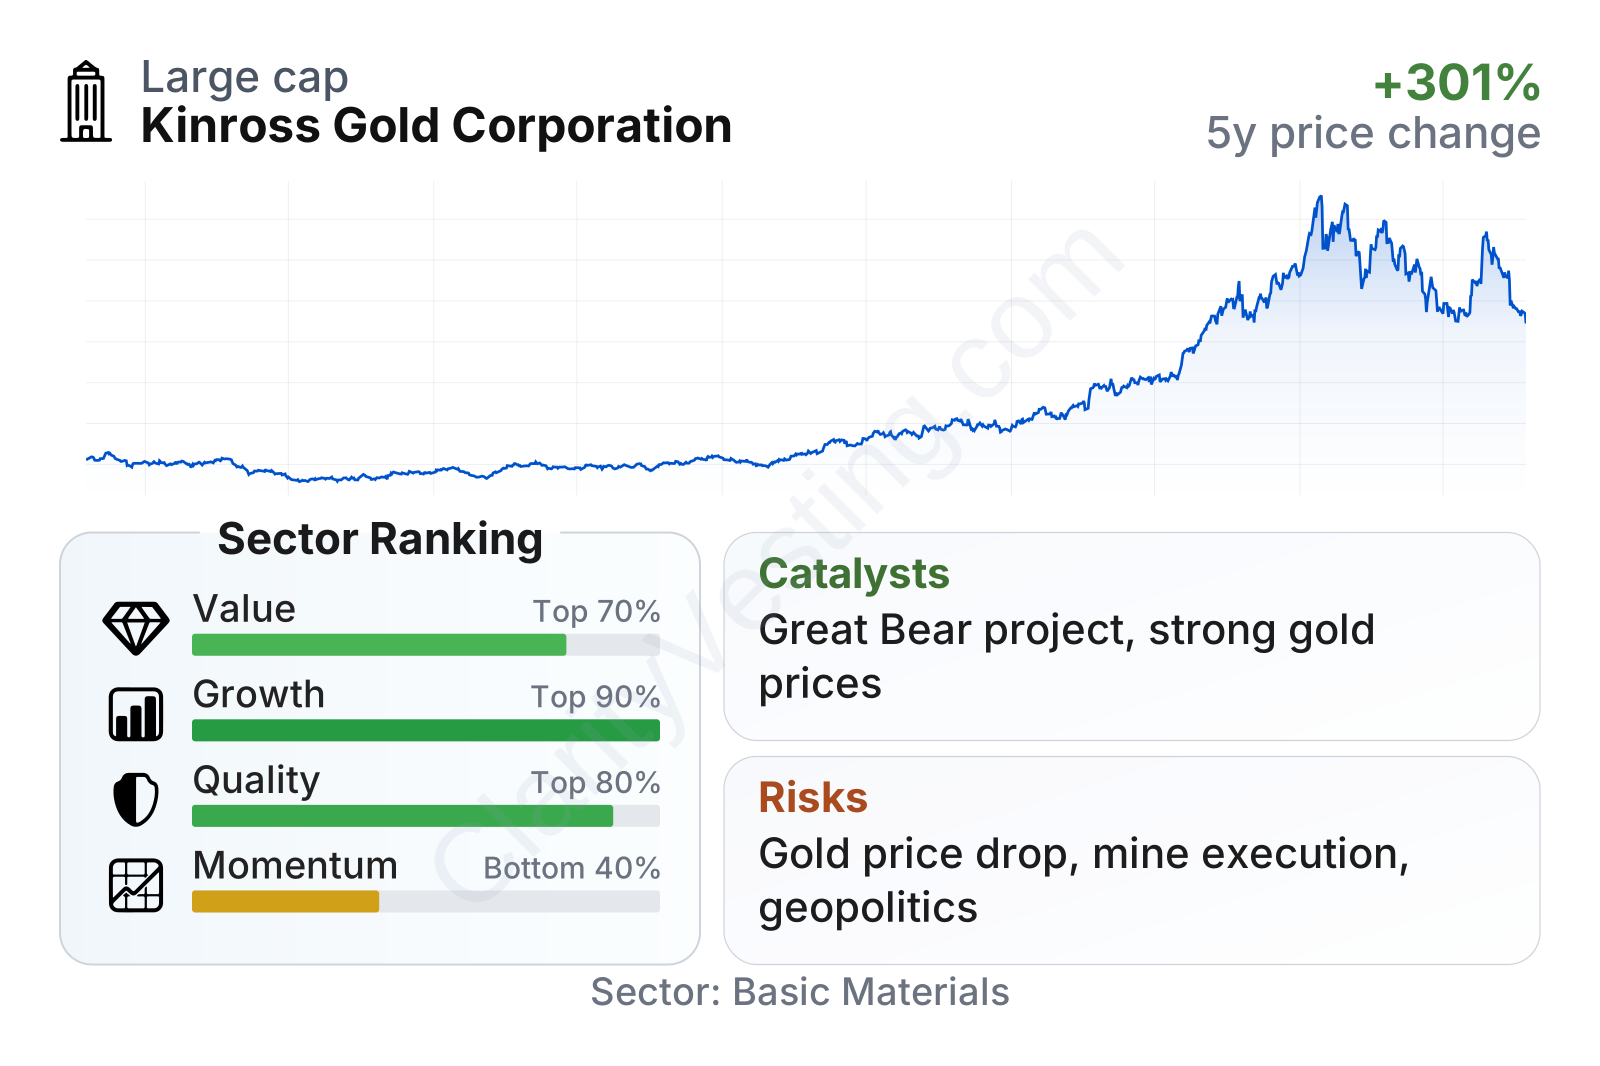
Kinross currently stands out for strong growth, strong quality, and above-average cash generation relative to much of the gold mining sector. Profitability metrics are well ahead of sector medians, leverage is very low, and free cash flow generation is unusually strong. Value metrics are mixed in an interesting way: earnings and enterprise-value-based measures look favorable, while the price-to-book ratio is higher than the sector median, which is common when the market gives more credit to asset quality and recent execution.
The share price has had a very large multi-year run, even with a notable pullback in recent months. That combination usually means the market has already recognized the operational improvement, but it also means volatility should be expected, especially in a commodity-linked stock with a beta above 1.4.
Growth
Kinross operates in a sector that remains structurally relevant for long-term capital preservation, central bank buying, and inflation-sensitive asset allocation. Gold itself does not have the same kind of volume-driven growth profile as technology or consumer markets, but gold miners can still grow through higher production, better mine plans, reserve replacement, acquisitions, and rising realized metal prices. In that context, Kinross has been benefiting from both stronger operating performance and a supportive gold price environment.
The company’s recent growth profile has been particularly strong for a miner. Revenue growth has been well above the sector median, and the longer-term trend in revenue per share, earnings per share, and operating margin has improved sharply. That is important because mining companies can sometimes grow sales without creating much value if costs rise just as quickly. Kinross has recently avoided that problem.
Revenue growth has stayed positive for an extended period, with several quarters showing especially strong year-over-year expansion. The recent pace is unlikely to stay this elevated every quarter, but the pattern still supports the view that Kinross is in a materially stronger operating phase than it was in 2021 and 2022.
Another major positive is cash generation. Free cash flow has increased dramatically, which gives the company more flexibility to fund projects, strengthen the balance sheet, return capital, or absorb periods of weaker commodity prices. In mining, free cash flow is one of the most useful signals because it shows whether accounting profits are translating into money left after capital spending.
Free cash flow has moved from modest levels to more than $3 billion on a trailing basis. For a gold miner, that is a meaningful change in financial capacity and suggests recent earnings strength is not just theoretical.
Kinross’s strategy for future growth appears sensible. Management has emphasized a pipeline of producing assets and development projects rather than relying on a single transformational bet. Key future drivers include extending mine lives, optimizing existing operations, and progressing large projects such as Great Bear in Canada, which has drawn attention as a potentially important long-term growth asset. For a miner, a credible development pipeline matters because every producing asset naturally depletes over time.
Recent company updates have also pointed to continued progress in operations and project development, while the broader backdrop for gold producers remains favorable if gold prices stay elevated. That does not guarantee uninterrupted growth, but it does create a visible opportunity set for Kinross over the next several years.
Risks
This article is for informational purposes only and does not constitute financial advice. Some content is AI-generated. See Disclaimer


