Stock Analysis · Kirby Corporation (KEX)
Overview
Kirby Corporation is a transportation and industrial services company best known for moving liquid cargo on inland waterways in the United States. Its barges and towboats carry products such as petroleum, chemicals, black oil, refined products, and agricultural liquids along river systems and coastwise routes. The company also operates a distribution and services business that supports engines, transmissions, and other equipment used in marine, power generation, oilfield, rail, and other industrial applications.
Kirby’s business is mainly split into two operating segments. Based on the latest full-year mix, revenue is weighted toward distribution and services, while marine transportation remains the larger profit driver because it generally earns stronger margins.
- Distribution and Services: approximately 53% of revenue in 2025. This segment sells parts and equipment and provides overhaul, repair, and maintenance services for diesel engines, transmissions, reduction gears, pumps, and related systems across marine and industrial end markets.
- Marine Transportation: approximately 47% of revenue in 2025. This includes inland tank barge transportation, which is the core business, plus a smaller coastal operation. Cargoes include petrochemicals, black oil, refined petroleum products, and agricultural chemicals.
For long-term readers, the key point is that Kirby is not a typical ocean shipping company. It is more specialized, with a leading position in U.S. inland tank barges, a market where the asset base, operating know-how, safety record, and customer relationships matter a great deal.
Over the past several years, the business mix has also become healthier. Revenue has grown steadily since 2021, while operating income and net income have improved much faster than sales, showing that pricing, utilization, and cost discipline have all moved in the right direction.
The profit picture has changed materially since 2021. Revenue has risen from a little above $2.2 billion to roughly $3.4 billion by 2025, but the more important change is the recovery in profitability: the company moved from an operating loss in 2021 to operating income above $500 million in 2025, with interest expense staying relatively contained as earnings expanded.
Key Figures
| Metric | Value | Sector ⓘ |
|---|---|---|
| Date | Oct 03, 2026 | |
| Context | ||
| Sector | Industrials | |
| Industry | Marine Shipping | |
| Market Cap ⓘ | $6.97B | |
| Beta ⓘ | 0.86 | |
Value (Cheapness) | ||
| P/E Ratio ⓘ | 20.21 | 22.45 |
| P/B Ratio ⓘ | 2.05 | 1.98 |
| FCF Yield ⓘ | 6.83% | 6.31% |
| Dividend Yield ⓘ | N/A | 1.96% |
| EBIT / EV ⓘ | 5.93% | 4.81% |
| PEG ⓘ | 2.63 | |
Growth (Business expansion) | ||
| Revenue Growth ⓘ | 7.80% | 9.10% |
| RPS Growth (5Y CAGR) ⓘ | 12.55% | 7.75% |
| EPS Growth (5Y CAGR) ⓘ | 11.61% | -13.59% |
| BVPS Growth (5Y CAGR) ⓘ | 5.85% | 6.22% |
| Margin Growth (5Y Trend) ⓘ | 26.43% | 0.72% |
| FCF Growth (5Y CAGR) ⓘ | 16.07% | 10.98% |
| DPS Growth (5Y CAGR) ⓘ | -77.44% | 9.48% |
Quality (Business durability) | ||
| ROIC (Latest) ⓘ | 8.45% | 10.92% |
| ROA (Latest) ⓘ | 5.61% | 5.41% |
| ROIC (5Y Median) ⓘ | 6.30% | 9.21% |
| ROA (5Y Median) ⓘ | 3.95% | 4.94% |
| Net Debt / EBIT (Latest) ⓘ | 2.45 | 2.07 |
| Net Debt / EBIT (5Y Median) ⓘ | 2.87 | 2.28 |
| Net Debt / EBITDA (Latest) ⓘ | 1.57 | 1.43 |
| Net Debt / Assets ⓘ | 19.10% | 19.27% |
| EBITDA / Interest ⓘ | 17.52 | 9.53 |
| Operating Margin (Latest) ⓘ | 13.94% | 10.50% |
| Operating Margin (5Y Median) ⓘ | 11.20% | 10.27% |
| Debt to Equity (Latest) ⓘ | 35.64% | 65.48% |
| Profit Margin (Latest) ⓘ | 10.18% | 6.62% |
| Free Cash Flow (Latest) ⓘ | $475.58M | |
Momentum (Price trend) | ||
| 3Y Return ⓘ | +58.51% | +58.56% |
| 12M Return (excl. last month) ⓘ | +45.95% | +15.63% |
| 6M Return ⓘ | -1.23% | +4.19% |
| Price vs. 200-Day MA ⓘ | -2.31% | +0.93% |
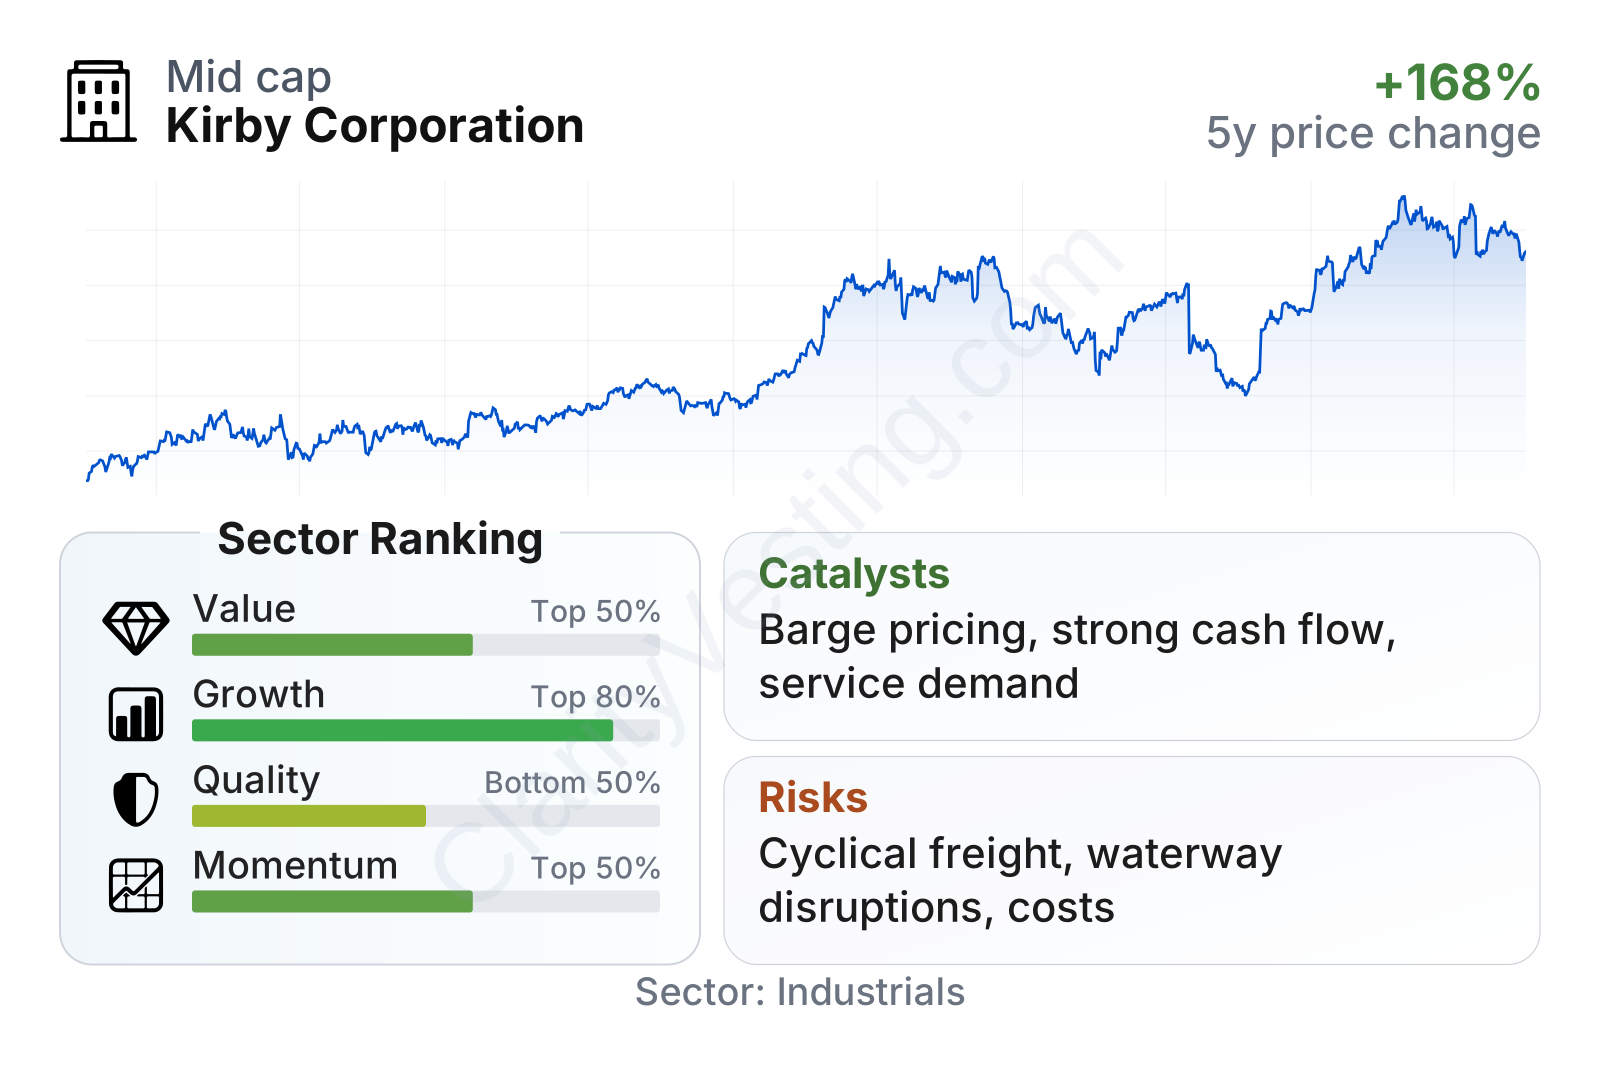
Kirby is a mid-to-large industrial company with a market value around $7 billion and a stock volatility that has been somewhat lower than the broader market. On valuation, it sits near the middle of its sector rather than at an extreme. On growth, the company ranks strongly versus peers, helped by solid multi-year gains in revenue per share, earnings per share, margins, and free cash flow. Quality is more mixed: leverage is manageable and interest coverage is strong, but returns on invested capital are still below the better operators in the sector.
The stock chart shows a strong long-term upward move, although with meaningful swings along the way. That pattern fits the business: Kirby benefits from improving barge markets and industrial demand, but sentiment can still change quickly when freight conditions or energy-related activity soften.
Growth
Kirby operates in markets that are mature in structure but still capable of attractive growth when supply is tight and replacement needs are high. Inland tank barges are essential infrastructure for moving bulk liquids across the U.S. river system, and this niche tends to have high barriers to entry because it requires specialized vessels, experienced crews, terminal relationships, and regulatory compliance. That does not create rapid expansion every year, but it can create durable pricing power when industry capacity is constrained.
The company’s strategy appears coherent for long-term growth. In marine transportation, management has emphasized disciplined pricing, fleet efficiency, selective capital spending, and contract renewals at better rates rather than aggressive fleet expansion. In distribution and services, the company has a broad installed base that can generate repeat parts and repair work, which adds a steadier revenue stream outside the transportation cycle.
Recent sales growth has moderated from the very strong rebound phase seen in 2022 and early 2023, but it remains positive again in 2026, running in the high-single-digit range recently. That matters because the current phase looks less like a short recovery bounce and more like a business that is still expanding after margins have already recovered.
Cash generation has been especially encouraging. Trailing free cash flow has climbed sharply over the past few years and is now close to $500 million. For a company with a capital-intensive fleet, that is an important signal: stronger cash flow gives Kirby more flexibility to reduce debt, refresh equipment, pursue bolt-on deals, and navigate downturns without depending too heavily on external financing.
A notable catalyst is the underlying supply-demand setup in inland barges. New vessel construction is not easily added overnight, and when demand for petrochemical and refined product movements remains healthy, tighter capacity can support higher contract pricing and better spot rates. Another opportunity comes from the services segment, where maintenance demand tends to persist because customers must keep engines and heavy equipment operating regardless of whether they are expanding aggressively.
Recent company communications have also pointed to continued favorable conditions in inland marine transportation and resilient demand in parts and service activity. That does not guarantee rapid acceleration, but it supports the case that Kirby still has room to grow earnings even if revenue growth stays moderate.
Risks
This article is for informational purposes only and does not constitute financial advice. Some content is AI-generated. See Disclaimer


