Stock Analysis · Kenon Holdings (KEN)
Overview
Kenon Holdings is a holding company whose value is now centered mainly on one large asset: its controlling stake in OPC Energy, an Israel-based power producer and electricity supplier. In simple terms, Kenon gives shareholders exposure to electricity generation, energy supply, and related energy infrastructure rather than to a broad mix of unrelated businesses. Over the last few years, the company has simplified its structure by exiting several older investments, which makes the business easier to understand but also more concentrated.
The economic engine behind Kenon is therefore OPC Energy. OPC develops, owns, and operates power plants, sells electricity, and participates in energy and infrastructure projects. This includes conventional generation, retail electricity activities, and growth initiatives tied to the energy transition. Because Kenon is primarily a holding company, its reported results can also be influenced by asset sales, revaluations, and financing items at the parent-company level, which helps explain why net income can swing much more sharply than revenue.
Based on the latest company structure and recent annual reporting, Kenon’s revenue exposure is overwhelmingly tied to OPC Energy.
- OPC Energy and related power activities: approximately 90%+ of Kenon’s underlying business exposure. This includes electricity generation, electricity sales, and energy infrastructure activities in Israel and selected U.S. projects.
- Other holding-company and residual items: a small portion of overall economic activity, generally linked to parent-level items rather than a stand-alone operating segment.
One useful takeaway is that Kenon should be analyzed less like a diversified conglomerate and more like a listed vehicle built around a single power platform. Revenue has trended up strongly in recent years, while operating profit has generally improved, but bottom-line results remain less predictable because non-operating items can be significant.
The long-term pattern points to rising revenue and improving operating income, but it also shows how much reported profit can move from year to year. In 2025, revenue and operating profit both advanced again, while net income dropped sharply from the unusually strong 2024 level, highlighting the difference between the core business trend and headline earnings volatility.
Key Figures
| Metric | Value | Sector ⓘ |
|---|---|---|
| Date | Oct 17, 2026 | |
| Context | ||
| Sector | Utilities | |
| Industry | Utilities - Independent Power Producers | |
| Market Cap ⓘ | $3.10B | |
| Beta ⓘ | 0.34 | |
Value (Cheapness) | ||
| P/E Ratio ⓘ | 27.69 | 17.28 |
| P/B Ratio ⓘ | 2.13 | 1.51 |
| FCF Yield ⓘ | -8.34% | 0.65% |
| Dividend Yield ⓘ | 6.28% | 3.77% |
| EBIT / EV ⓘ | 6.03% | 5.01% |
| PEG ⓘ | N/A | |
Growth (Business expansion) | ||
| Revenue Growth ⓘ | 93.40% | 6.10% |
| RPS Growth (5Y CAGR) ⓘ | 16.58% | 3.87% |
| EPS Growth (5Y CAGR) ⓘ | -32.26% | -11.30% |
| BVPS Growth (5Y CAGR) ⓘ | -2.19% | 4.23% |
| Margin Growth (5Y Trend) ⓘ | -162.71% | 3.57% |
| FCF Growth (5Y CAGR) ⓘ | 114.94% | -8.84% |
| DPS Growth (5Y CAGR) ⓘ | 28.92% | 4.84% |
Quality (Business durability) | ||
| ROIC (Latest) ⓘ | 6.60% | 6.53% |
| ROA (Latest) ⓘ | 2.02% | 3.20% |
| ROIC (5Y Median) ⓘ | 3.61% | 5.95% |
| ROA (5Y Median) ⓘ | 7.98% | 2.75% |
| Net Debt / EBIT (Latest) ⓘ | 5.04 | 7.13 |
| Net Debt / EBIT (5Y Median) ⓘ | 1.48 | 7.23 |
| Net Debt / EBITDA (Latest) ⓘ | 3.81 | 4.31 |
| Net Debt / Assets ⓘ | 20.12% | 38.42% |
| EBITDA / Interest ⓘ | 4.21 | 4.58 |
| Operating Margin (Latest) ⓘ | 24.35% | 20.83% |
| Operating Margin (5Y Median) ⓘ | 23.82% | 20.08% |
| Debt to Equity (Latest) ⓘ | 202.12% | 137.69% |
| Profit Margin (Latest) ⓘ | 10.02% | 11.37% |
| Free Cash Flow (Latest) ⓘ | -$258.61M | |
Momentum (Price trend) | ||
| 3Y Return ⓘ | +313.50% | +52.37% |
| 12M Return (excl. last month) ⓘ | +44.03% | +8.84% |
| 6M Return ⓘ | -24.56% | -3.95% |
| Price vs. 200-Day MA ⓘ | -15.24% | -0.79% |
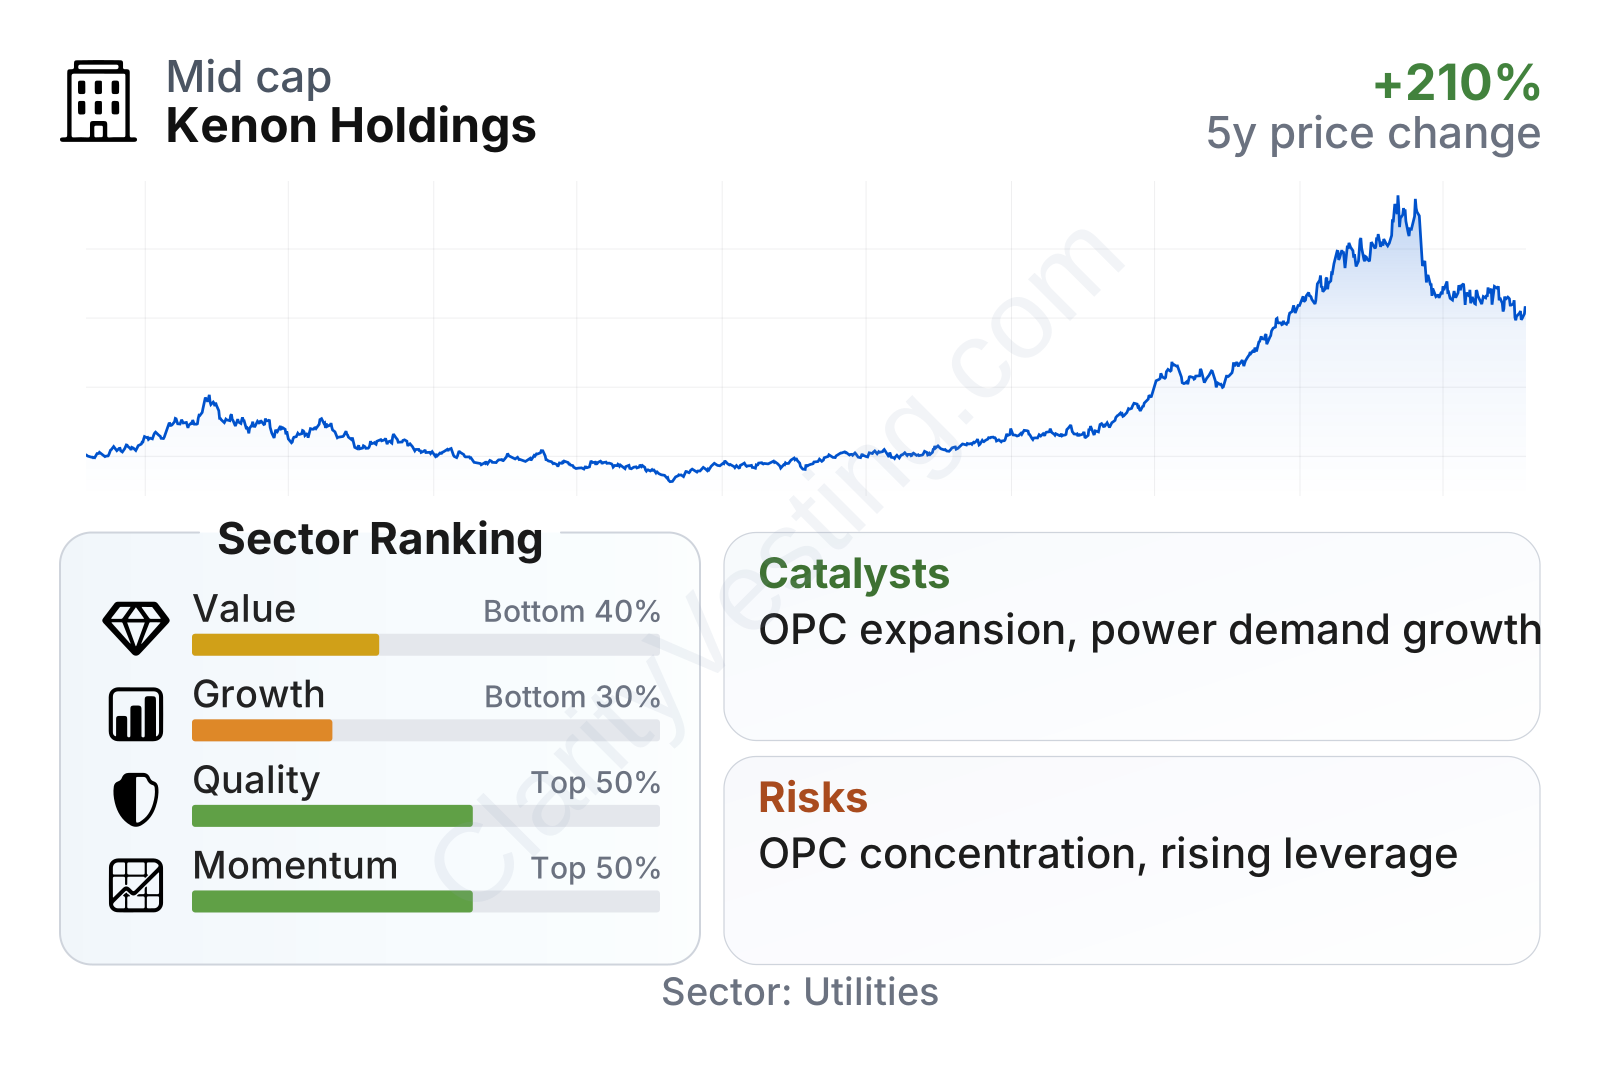
Kenon is a mid-sized utility-related company with a relatively low-beta stock, meaning its trading pattern has historically been less sensitive than the broader market. The table suggests a mixed profile: quality is around the sector middle, momentum remains solid over multi-year periods, but value and growth rankings are weaker because the share price has moved up much faster than earnings stability and because recent cash generation has been soft.
The current picture is especially unusual because some headline growth numbers look very strong while underlying profitability and cash flow are less impressive. Revenue growth has been exceptional, and operating margins are above the sector median, yet free cash flow is negative and leverage has moved up. That combination often means the market is paying for expected future expansion rather than simply today’s cash output.
Growth
Kenon operates in a sector with durable long-term relevance. Electricity demand tends to rise over time as economies expand, data centers consume more power, and electrification spreads into transportation, industry, and buildings. That does not guarantee smooth growth every year, but it creates a supportive backdrop for companies that own power generation and energy infrastructure.
Kenon’s strategy also makes sense in that context. By concentrating on OPC Energy, the company is focused on an area where scale, local infrastructure knowledge, and access to regulated or semi-contracted energy markets matter. This is a clearer growth plan than running a portfolio of unrelated assets. The company’s recent financial trend supports that view: revenue has climbed each year from 2021 through 2025, and revenue per share has also moved steadily higher.
The steady rise in revenue per share is important because it suggests growth is not only coming from accounting noise or one-time items. It indicates that the underlying business base has been expanding over several years, even though earnings per share have been more volatile.
One of the clearest catalysts is the broader need for new power capacity and grid support. In markets like Israel, where power demand growth and reliability are critical, efficient private generation assets can be valuable. OPC has also been developing activity in the United States, which offers another avenue for expansion if projects are executed well. For Kenon, that means the main upside depends on OPC turning its project pipeline into dependable earnings and cash flow.
There is also a recent market signal worth noting: the stock price had a very strong run over the past three years and accelerated sharply into early 2026 before pulling back. That kind of move usually reflects rising expectations around asset value, future projects, or capital returns. Even after the retreat from the peak, the market appears to be assigning more strategic value to Kenon than it did a few years ago.
The main growth caveat is that free cash flow has been inconsistent and is currently negative. That is not automatically alarming for a utility-style business investing in expansion, but it does mean growth is still relying on capital deployment today in the hope of stronger cash generation later. For a long-term case, the key test is whether new capacity and projects convert into durable cash inflows, not just higher revenue.
Risks
This article is for informational purposes only and does not constitute financial advice. Some content is AI-generated. See Disclaimer


