Stock Analysis · Johnson & Johnson (JNJ)
Overview
Johnson & Johnson is one of the world’s largest healthcare companies. After separating its consumer health business into Kenvue, the company is now focused on two main activities: innovative medicines and medical technology. In simple terms, it develops prescription drugs for diseases such as cancer, autoimmune disorders, and neuroscience-related conditions, and it also sells medical devices used in surgery, orthopedics, cardiovascular care, and vision.
This narrower structure makes the company easier to understand than it was a few years ago. The business is now centered on areas where product development, patents, clinical evidence, and global commercial scale matter a lot. That usually creates more durable positions than lower-margin consumer products, but it also increases exposure to patent cycles, regulation, and product litigation.
Based on recent annual reporting, Johnson & Johnson’s revenue mix is approximately the following:
- Innovative Medicine: about 64% of revenue. This includes prescription medicines across oncology, immunology, neuroscience, cardiovascular and pulmonary hypertension, and other specialized therapies.
- MedTech: about 36% of revenue. This includes surgery tools, orthopedics, vision products, electrophysiology, and other devices used by hospitals and specialists.
Within that structure, pharmaceutical products remain the largest earnings engine because they typically carry stronger margins than devices. MedTech adds diversification, global hospital exposure, and a steadier installed-base business, even if growth is often more moderate than in breakthrough drug categories.
The company’s financial profile also shows a business that converts a large share of sales into gross profit, while continuing to spend heavily on research, commercialization, and acquisitions. Revenue has moved higher over the last several years, and profitability has recovered after a more uneven period shaped by portfolio changes and one-off items.
The broad pattern is a favorable one: sales and gross profit have trended upward over time, research spending remains substantial, and operating profit improved meaningfully in the latest full year after a weaker 2024. That combination suggests a company still funding innovation while preserving strong underlying economics.
Key Figures
| Metric | Value | Sector ⓘ |
|---|---|---|
| Date | Oct 19, 2026 | |
| Context | ||
| Sector | Healthcare | |
| Industry | Drug Manufacturers - General | |
| Market Cap ⓘ | $615.87B | |
| Beta ⓘ | 0.21 | |
Value (Cheapness) | ||
| P/E Ratio ⓘ | 38.78 | 24.87 |
| P/B Ratio ⓘ | 7.37 | 3.08 |
| FCF Yield ⓘ | 3.04% | 3.15% |
| Dividend Yield ⓘ | 0.51% | 1.94% |
| EBIT / EV ⓘ | 3.84% | 0.57% |
| PEG ⓘ | 2.82 | |
Growth (Business expansion) | ||
| Revenue Growth ⓘ | 5.90% | 7.45% |
| RPS Growth (5Y CAGR) ⓘ | 7.12% | 8.61% |
| EPS Growth (5Y CAGR) ⓘ | -5.59% | -17.81% |
| BVPS Growth (5Y CAGR) ⓘ | 4.94% | 3.72% |
| Margin Growth (5Y Trend) ⓘ | 11.03% | -0.62% |
| FCF Growth (5Y CAGR) ⓘ | -0.08% | 1.04% |
| DPS Growth (5Y CAGR) ⓘ | 5.42% | 6.77% |
Quality (Business durability) | ||
| ROIC (Latest) ⓘ | 16.57% | 3.24% |
| ROA (Latest) ⓘ | 10.68% | 3.01% |
| ROIC (5Y Median) ⓘ | 17.42% | 4.60% |
| ROA (5Y Median) ⓘ | 11.70% | 1.89% |
| Net Debt / EBIT (Latest) ⓘ | 1.10 | 1.34 |
| Net Debt / EBIT (5Y Median) ⓘ | 0.84 | 1.84 |
| Net Debt / EBITDA (Latest) ⓘ | 0.85 | 1.00 |
| Net Debt / Assets ⓘ | 14.23% | 5.45% |
| EBITDA / Interest ⓘ | 38.61 | 9.64 |
| Operating Margin (Latest) ⓘ | 26.53% | 9.27% |
| Operating Margin (5Y Median) ⓘ | 24.59% | 7.38% |
| Debt to Equity (Latest) ⓘ | 57.71% | 28.58% |
| Profit Margin (Latest) ⓘ | 16.20% | 3.59% |
| Free Cash Flow (Latest) ⓘ | $18.71B | |
Momentum (Price trend) | ||
| 3Y Return ⓘ | +78.30% | +42.80% |
| 12M Return (excl. last month) ⓘ | +54.88% | +18.50% |
| 6M Return ⓘ | +10.13% | +7.62% |
| Price vs. 200-Day MA ⓘ | +5.47% | +5.16% |
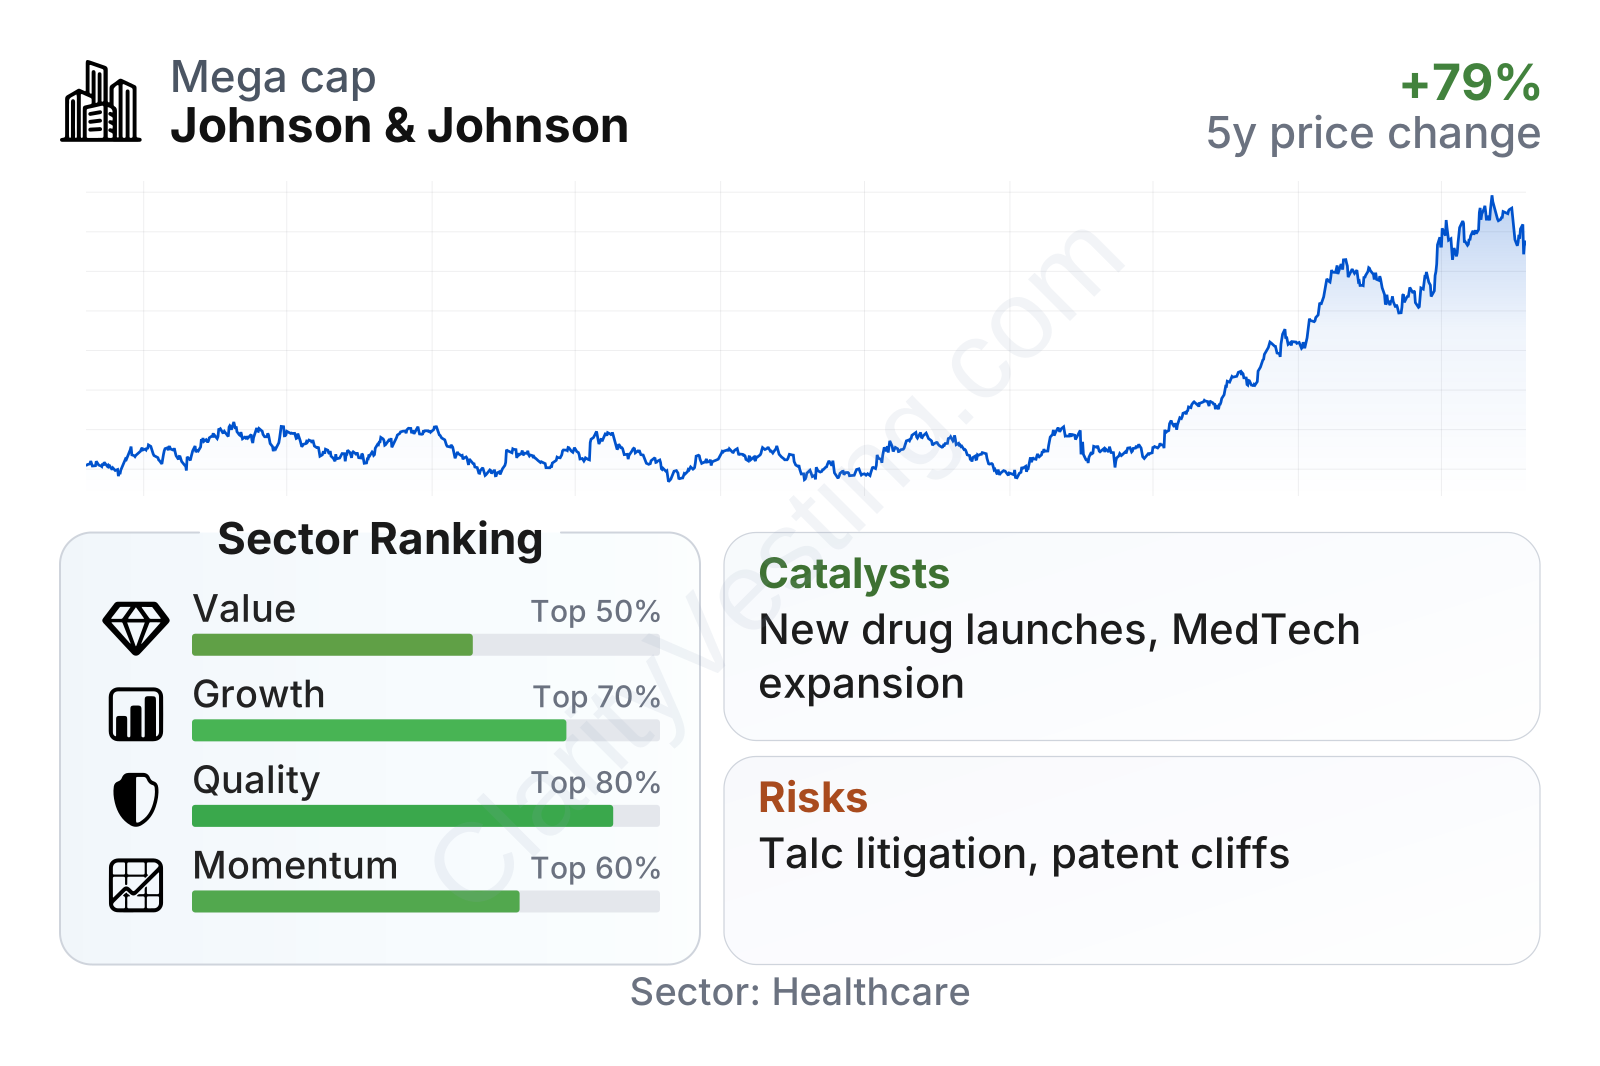
Johnson & Johnson stands out first for scale and stability. It is one of the largest businesses in healthcare, and its share price volatility has been unusually low, with a beta near 0.2. On quality, it ranks strongly versus much of the sector: returns on capital and assets are well above industry medians, operating margin is around 27%, and profit margin is roughly 16%, also comfortably above sector norms.
The growth picture is more mixed. Recent revenue growth has been positive, but still a bit below the sector median, and free cash flow has been more stable than fast-growing over the last five years. Margin trends have improved, which helps explain why earnings quality looks stronger than top-line momentum alone.
Valuation is where the profile becomes more demanding. The stock trades on higher-than-median earnings and book multiples, while free cash flow yield is roughly in line with the sector. In other words, the market is assigning a premium for durability, brand strength, and profitability rather than for rapid expansion.
Growth
Johnson & Johnson operates in a sector with durable long-term demand. Aging populations, rising rates of chronic disease, more surgical procedures, and continued medical innovation all support healthcare spending over time. That does not guarantee smooth growth every year, but it does provide a favorable backdrop for large, diversified companies with deep research capabilities and broad global distribution.
The company’s strategy is coherent for that environment. In pharmaceuticals, management has been emphasizing higher-value disease areas where scientific differentiation and patent protection can support pricing power. In MedTech, it has been adding higher-growth device categories, especially in electrophysiology and other specialized procedures, while benefiting from hospitals returning to more normal procedure volumes.
Revenue growth has clearly improved after a period of contraction linked to portfolio changes and comparisons distorted by the consumer separation. More recently, growth has returned to the mid-single-digit to high-single-digit range, which indicates the core business is expanding again rather than simply reshuffling assets.
Free cash flow has remained very large, generally around the high teens of billions of dollars on a trailing basis. Even without a strong upward trend lately, that level of cash generation matters because it supports research, acquisitions, dividends, debt service, and legal settlements without putting the operating model under obvious strain.
One of the clearest catalysts is the company’s drug pipeline and newer product launches. Johnson & Johnson has been working to offset pressure from older blockbuster medicines with newer oncology and immunology products. Another growth driver is MedTech, where procedure recovery, product innovation, and tuck-in acquisitions can steadily expand revenue. Recent company communications have also highlighted continued investment in robotic and digitally assisted surgery, an area that could strengthen the device franchise over time if adoption broadens.
Risks
This article is for informational purposes only and does not constitute financial advice. Some content is AI-generated. See Disclaimer


