Stock Analysis · China Gold International Resources (JINFF)
Overview
China Gold International Resources is a mining company focused on producing gold and copper in China. It is listed in North America and controlled by China National Gold Group, one of the country’s major state-backed gold producers. The company’s asset base is concentrated in two operating mines: the Chang Shan Hao gold mine in Inner Mongolia and the Jiama copper-gold-polymetallic mine in Tibet.
Its business model is straightforward: extract ore, process it, and sell the resulting metal products. That means revenue mainly depends on three things: production volumes, the grade and recovery of ore, and commodity prices. Because the company operates only a small number of mines, performance can swing sharply when one asset faces interruptions or ramps back up.
The main revenue sources are usually split between copper-related sales and gold-related sales, with some by-product contribution from other metals at Jiama. Based on the company’s mine profile and recent operating mix, revenue is broadly driven by:
- Copper concentrate and copper-related sales: approximately 55% to 70% of revenue in stronger Jiama periods. This includes copper produced at Jiama, where gold, silver, lead, and zinc can also be recovered as by-products.
- Gold sales: approximately 25% to 40% of revenue, mainly from Chang Shan Hao and part of Jiama’s output.
- Other metals and by-products: usually a low-single-source contribution in percentage terms when disclosed separately, tied mostly to Jiama’s polymetallic nature.
This is therefore not a diversified global miner with dozens of assets. It is a relatively concentrated producer whose results are heavily tied to the operating stability of Jiama and to the price environment for copper and gold.
The long-term financial picture shows why operational continuity matters so much here. Revenue and profit weakened sharply in 2023, then recovered in 2024 and accelerated strongly in 2025, with operating income and net income rebounding much faster than sales. That pattern suggests the business has meaningful operating leverage: when production normalizes and prices cooperate, earnings can improve very quickly.
Key Figures
| Metric | Value | Sector ⓘ |
|---|---|---|
| Date | Oct 24, 2026 | |
| Context | ||
| Sector | Basic Materials | |
| Industry | Other Precious Metals & Mining | |
| Market Cap ⓘ | $10.83B | |
| Beta ⓘ | 1.84 | |
Value (Cheapness) | ||
| P/E Ratio ⓘ | 14.01 | 16.92 |
| P/B Ratio ⓘ | 3.86 | 1.66 |
| FCF Yield ⓘ | 8.17% | 5.83% |
| Dividend Yield ⓘ | 1.28% | 2.07% |
| EBIT / EV ⓘ | 7.86% | 6.38% |
| PEG ⓘ | N/A | |
Growth (Business expansion) | ||
| Revenue Growth ⓘ | 50.00% | 11.25% |
| RPS Growth (5Y CAGR) ⓘ | 3.60% | 4.49% |
| EPS Growth (5Y CAGR) ⓘ | 26.55% | -15.24% |
| BVPS Growth (5Y CAGR) ⓘ | 5.87% | 5.49% |
| Margin Growth (5Y Trend) ⓘ | 13.89% | -1.54% |
| FCF Growth (5Y CAGR) ⓘ | 24.83% | 0.37% |
| DPS Growth (5Y CAGR) ⓘ | -10.04% | 5.91% |
Quality (Business durability) | ||
| ROIC (Latest) ⓘ | 27.38% | 9.59% |
| ROA (Latest) ⓘ | 22.45% | 4.92% |
| ROIC (5Y Median) ⓘ | 8.95% | 7.91% |
| ROA (5Y Median) ⓘ | 6.90% | 3.92% |
| Net Debt / EBIT (Latest) ⓘ | -0.17 | 1.36 |
| Net Debt / EBIT (5Y Median) ⓘ | 2.24 | 1.69 |
| Net Debt / EBITDA (Latest) ⓘ | -0.14 | 0.93 |
| Net Debt / Assets ⓘ | -4.24% | 13.69% |
| EBITDA / Interest ⓘ | 76.97 | 12.38 |
| Operating Margin (Latest) ⓘ | 56.01% | 13.24% |
| Operating Margin (5Y Median) ⓘ | 27.21% | 11.82% |
| Debt to Equity (Latest) ⓘ | 18.14% | 40.30% |
| Profit Margin (Latest) ⓘ | 47.08% | 6.38% |
| Free Cash Flow (Latest) ⓘ | $884.64M | |
Momentum (Price trend) | ||
| 3Y Return ⓘ | +501.60% | +73.47% |
| 12M Return (excl. last month) ⓘ | +89.49% | +27.59% |
| 6M Return ⓘ | +12.04% | -4.02% |
| Price vs. 200-Day MA ⓘ | +7.46% | -0.65% |
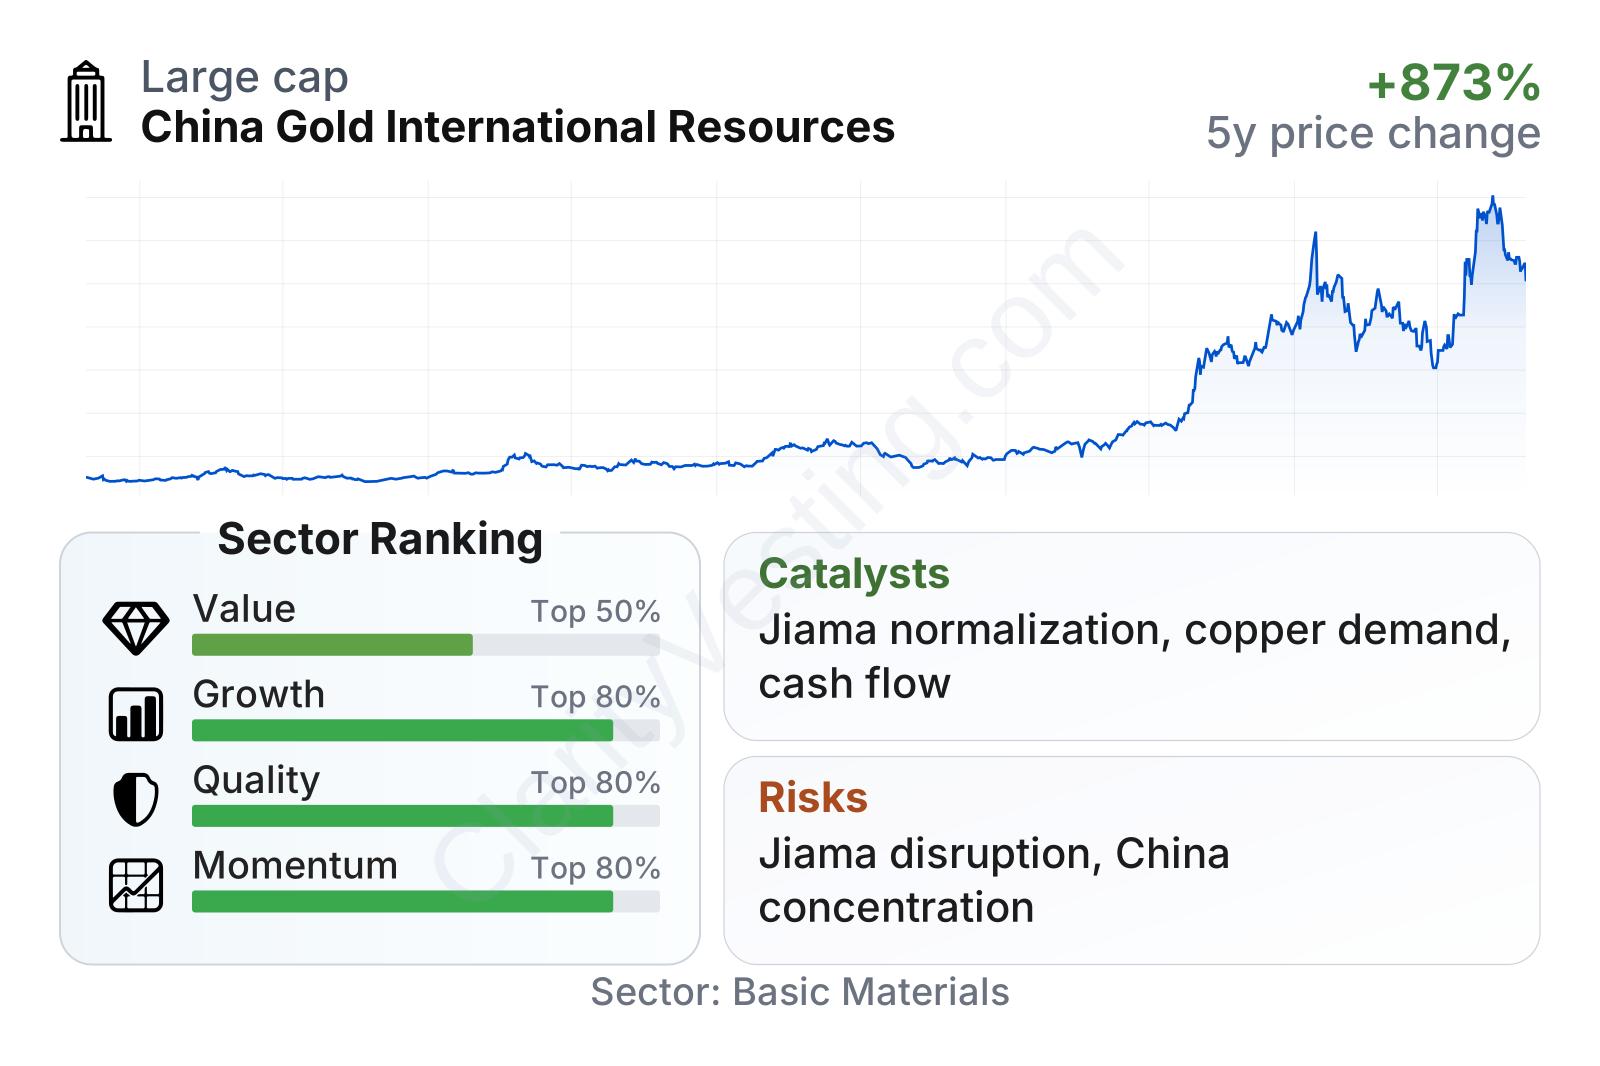
China Gold International Resources is now a large mining company by market value, but it still carries the asset concentration of a much narrower operator. The stock has shown unusually strong momentum over the past one, three, and six-month periods, far ahead of the sector median, which signals that the market has been reacting to a major improvement in operating and earnings conditions. On fundamentals, the company ranks well on growth, quality, and momentum, while the value picture is mixed: earnings and cash flow measures still look acceptable relative to peers, but the price-to-book multiple is clearly richer than the sector median.
Profitability stands out. Returns on capital and assets are well above sector norms, recent operating margin is exceptionally high, and leverage is modest. Free cash flow generation has also improved materially. Altogether, the current profile looks much stronger than it did during the operational downturn in 2023 and early 2024.
Growth
The company sits at the intersection of two sectors with solid long-term demand support. Gold remains relevant as a store of value and tends to attract interest during periods of inflation, geopolitical tension, or financial stress. Copper is even more directly linked to structural growth themes because it is a core material for power grids, electric vehicles, renewable energy systems, and industrial electrification. That gives China Gold International Resources exposure to both defensive and cyclical demand drivers.
The main strategic logic is simple: stabilize and optimize existing assets rather than pursue a highly dispersed portfolio. For a company with only two core mines, that can be very effective if management keeps production steady and improves throughput and recovery. The strongest internal growth lever is Jiama, because it is the larger and more operationally significant asset. When Jiama performs well, group revenue and earnings can rise sharply.
Recent revenue growth shows exactly this kind of rebound effect. After a deep contraction through 2023 and early 2024, growth turned sharply positive and remained elevated into 2025 and 2026. Even allowing for a low comparison base, the scale of the turnaround points to much more than normal price variation; it indicates a meaningful recovery in operations and output.
Cash generation tells a similar story. Free cash flow moved from negative territory during the weaker period to a strong positive level more recently. For a miner, this matters because accounting earnings can move around with metal prices and asset charges, while free cash flow better shows whether the company is actually converting improved conditions into money that can strengthen the balance sheet and support future development.
A visible near-term catalyst is the continued normalization and optimization of Jiama. If production remains stable and metal prices stay supportive, the company has room to keep translating higher volumes into disproportionate profit growth. Another favorable factor is the broader copper market backdrop: large new copper supply is difficult and expensive to bring online globally, which can support pricing for established producers with operating mines.
Risks
This article is for informational purposes only and does not constitute financial advice. Some content is AI-generated. See Disclaimer


