Stock Analysis · Jupiter Fund Management Plc (JFHHF)
Overview
Jupiter Fund Management Plc is a U.K.-based asset manager. In simple terms, it runs investment funds and wealth strategies for individuals, financial advisers, and institutional clients, and it earns money mainly by charging fees on the assets it manages. Its business is tied closely to two things: how much client money it oversees and how investment markets perform.
Jupiter’s revenue is primarily made up of management fees, with a smaller contribution from performance fees and other operating income. Based on the company’s recent reporting structure, the business is best understood as fee income generated from investment products distributed across retail/intermediary and institutional channels rather than from manufacturing or lending activities.
The main revenue sources can be summarized as follows:
- Recurring management fees: approximately 85% to 95% of revenue. These are ongoing fees charged on assets under management across mutual funds, segregated mandates, and other investment vehicles.
- Performance fees: approximately 0% to 10% of revenue, depending on market conditions and fund outperformance. This line can be volatile from year to year.
- Other income: approximately 3% to 8% of revenue. This may include smaller operating items linked to administration or ancillary activities.
By investment offering, Jupiter is diversified across active equity, fixed income, multi-asset, and alternatives, with increasing emphasis in recent years on higher-margin specialist strategies. Geographically, the company remains centered on the U.K. and Europe, but it also serves clients in Asia and other international markets through distribution partnerships.
The business model is relatively asset-light. It does not need heavy capital spending to grow in the way an industrial company would. Instead, its economics depend on investment performance, brand credibility, distribution reach, and cost control. That can make profits highly sensitive to investor sentiment, but it also allows strong cash generation when flows and markets are supportive.
The financial flow over the last few years shows a business that went through a sharp downturn in 2022 and 2023, then recovered in 2024 and improved further in 2025. Revenue remains below the 2021 peak, but operating income and net income have rebounded meaningfully, helped by tighter operating expenses and lower financing costs.
Key Figures
| Metric | Value | Sector ⓘ |
|---|---|---|
| Date | Oct 17, 2026 | |
| Context | ||
| Sector | Financial Services | |
| Industry | Asset Management | |
| Market Cap ⓘ | $1.29B | |
| Beta ⓘ | 1.27 | |
Value (Cheapness) | ||
| P/E Ratio ⓘ | 10.88 | 12.26 |
| P/B Ratio ⓘ | 2.19 | 1.23 |
| FCF Yield ⓘ | 15.71% | 10.40% |
| Dividend Yield ⓘ | 2.30% | 3.02% |
| EBIT / EV ⓘ | N/A | 8.14% |
| PEG ⓘ | N/A | |
Growth (Business expansion) | ||
| Revenue Growth ⓘ | 38.60% | 9.35% |
| RPS Growth (5Y CAGR) ⓘ | -13.14% | 12.19% |
| EPS Growth (5Y CAGR) ⓘ | -46.89% | -9.53% |
| BVPS Growth (5Y CAGR) ⓘ | -7.31% | 4.99% |
| Margin Growth (5Y Trend) ⓘ | -2.55% | -3.86% |
| FCF Growth (5Y CAGR) ⓘ | -23.96% | 4.81% |
| DPS Growth (5Y CAGR) ⓘ | -38.13% | 8.79% |
Quality (Business durability) | ||
| ROIC (Latest) ⓘ | N/A | 9.49% |
| ROE (Latest) ⓘ | 18.92% | 13.90% |
| ROA (Latest) ⓘ | 12.57% | 1.55% |
| ROIC (5Y Median) ⓘ | 9.79% | 7.86% |
| ROE (5Y Median) ⓘ | 8.03% | 12.17% |
| ROA (5Y Median) ⓘ | 5.29% | 1.30% |
| Net Debt / EBIT (Latest) ⓘ | -1.34 | 0.96 |
| Net Debt / EBIT (5Y Median) ⓘ | -1.94 | 0.73 |
| Net Debt / EBITDA (Latest) ⓘ | -1.19 | 0.92 |
| Operating Margin (Latest) ⓘ | 24.41% | 22.30% |
| Operating Margin (5Y Median) ⓘ | 23.40% | 24.63% |
| Debt to Equity (Latest) ⓘ | 4.78% | 58.56% |
| Profit Margin (Latest) ⓘ | 21.21% | 26.57% |
| Free Cash Flow (Latest) ⓘ | $202.79M | |
Momentum (Price trend) | ||
| 3Y Return ⓘ | +145.14% | +88.33% |
| 12M Return (excl. last month) ⓘ | +60.45% | +19.38% |
| 6M Return ⓘ | +6.35% | +4.75% |
| Price vs. 200-Day MA ⓘ | +5.43% | +3.50% |
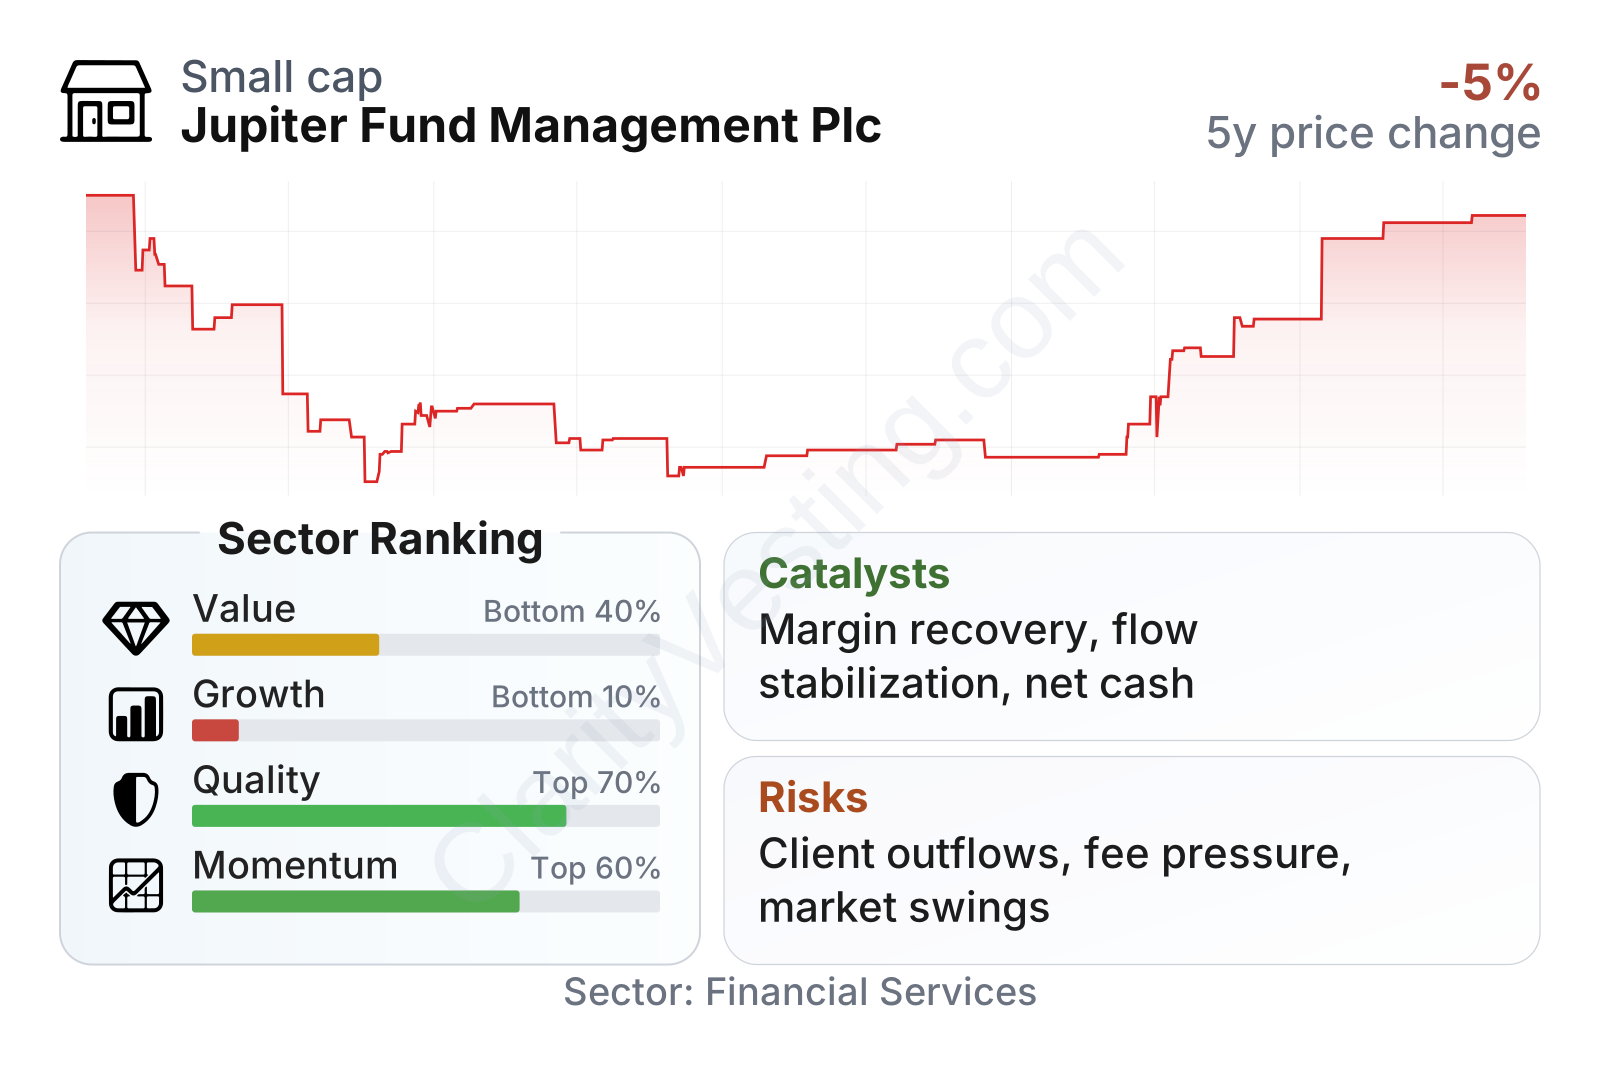
Jupiter is a mid-sized listed asset manager with above-average share price volatility, as shown by a beta of about 1.3. The recent market trend has been strong: the stock has risen materially over the last 12 months and over the last three years, even though the shorter six-month move has been more moderate.
On valuation measures, the picture is mixed. The earnings multiple is below the sector median, and free cash flow yield is stronger than the median, which points to decent cash generation relative to the share price. However, the price-to-book multiple is above the sector median, so the market is assigning a richer balance-sheet valuation than it once did.
Quality metrics are generally solid. Returns on equity and assets are ahead of sector medians, operating margin is slightly above the median, and the balance sheet looks conservative, with very low leverage and net cash rather than net debt. That financial strength matters in a business where earnings can swing with markets.
The weakest area is longer-term growth. While recent year-over-year revenue growth has been strong, five-year trends for revenue per share, earnings per share, free cash flow, dividends, and book value per share are all negative. In other words, the near-term recovery is clear, but it comes after a difficult multiyear period.
Growth
Asset management remains a structurally important sector, but it is not an easy one. Long-term growth comes from rising household savings, retirement investing, and demand for professionally managed products. At the same time, the industry faces fee pressure from passive funds, stronger regulation, and intense competition for client flows. That means growth tends to favor firms with either standout investment performance, a strong niche, or broad distribution power.
Jupiter’s strategy appears logical in that context. The company has been focusing on sharpening its product lineup, improving efficiency, and building around areas where active management can still command attractive fees, such as specialist fixed income, unconstrained strategies, and selected alternatives. For a firm of Jupiter’s size, trying to compete head-on with the largest global platforms on scale alone would be difficult, so specialization is a more sensible path.
A meaningful catalyst is operating leverage. Because asset managers have a large fixed-cost base, an improvement in markets or net flows can lift profitability quickly. Jupiter’s recent rebound in revenue and earnings shows this effect already. If the company can combine stable investment performance with even modest net inflows, profits can improve faster than revenue.
Another support is its balance sheet. With low leverage and solid free cash flow, Jupiter has room to fund dividends, invest in distribution, or consider selective acquisitions without the same financial pressure faced by more indebted peers. In a consolidating industry, financial flexibility can be strategically useful.
The trend in book value per share, however, reminds readers that the recovery is not yet a straight-line compounding story. Book value was broadly stable for several years before dropping more noticeably in the latest period, which suggests that recent progress still needs to translate into more durable balance-sheet growth.
Recent company updates and annual reporting have emphasized cost discipline, product focus, and efforts to stabilize flows. For Jupiter, the most important opportunity is not a single breakthrough event, but rather consistent execution: retaining assets, improving net flows, and sustaining better margins over multiple reporting periods.
Risks
This article is for informational purposes only and does not constitute financial advice. Some content is AI-generated. See Disclaimer


