Stock Analysis · Jefferies Financial Group Inc (JEF)
Overview
Jefferies Financial Group Inc is a diversified financial company built around an investment bank and broker-dealer platform. In simple terms, it helps corporations, governments, and financial sponsors raise money, complete mergers and acquisitions, trade securities, and manage investment portfolios. The company also owns a meaningful merchant banking and asset management operation, which makes Jefferies different from some pure advisory firms because part of its earnings can come from investments it owns, not only from client fees.
The core business is Jefferies Group, the investment banking and capital markets arm. Based on Jefferies Financial Group’s recent annual reporting, the largest revenue source is typically capital markets and advisory activity inside this segment, while the rest comes from asset management, merchant banking gains or losses, and a small amount from other businesses and corporate items. Because investment banks report revenue in a way that can move sharply with market conditions, exact mix percentages can vary a lot year to year.
A practical way to think about the business mix is the following:
- Investment banking advisory and underwriting: roughly the largest contributor in stronger deal years, often around 30% to 40% of segment revenue. This includes merger advice, equity offerings, and debt issuance.
- Equities and fixed income trading: often around 30% to 40%. This includes market-making, client execution, and related trading services for stocks, bonds, currencies, and other securities.
- Asset management and related fees: usually a smaller contributor, often around 5% to 10%, depending on market levels and fee generation.
- Merchant banking and principal investments: a variable contribution that can range widely, often around 10% to 20% over time but sometimes materially higher or lower depending on gains, losses, and realizations.
- Other businesses and corporate items: generally the smallest portion and sometimes a drag on reported results.
That mix matters for long-term analysis because Jefferies is not only exposed to recurring client activity but also to market cycles, deal activity, and the valuation of investments on its own balance sheet.
The multi-year picture shows that revenue rebounded strongly after the softer 2022-2023 period, but profit conversion has been more uneven than revenue growth alone would suggest. A notable point is that operating expenses rose sharply in the latest year shown, which helps explain why a larger revenue base did not translate into equally strong bottom-line expansion.
Key Figures
| Metric | Value | Sector ⓘ |
|---|---|---|
| Date | Oct 03, 2026 | |
| Context | ||
| Sector | Financial Services | |
| Industry | Capital Markets | |
| Market Cap ⓘ | $9.30B | |
| Beta ⓘ | 1.49 | |
Value (Cheapness) | ||
| P/E Ratio ⓘ | 12.56 | 12.60 |
| P/B Ratio ⓘ | 870.35 | 1.23 |
| FCF Yield ⓘ | 19.13% | 10.16% |
| Dividend Yield ⓘ | 3.44% | 2.96% |
| EBIT / EV ⓘ | 4.99% | 7.77% |
| PEG ⓘ | 1.03 | |
Growth (Business expansion) | ||
| Revenue Growth ⓘ | 8.50% | 9.50% |
| RPS Growth (5Y CAGR) ⓘ | 10.20% | 12.10% |
| EPS Growth (5Y CAGR) ⓘ | -4.49% | -9.45% |
| BVPS Growth (5Y CAGR) ⓘ | 4.53% | 5.01% |
| Margin Growth (5Y Trend) ⓘ | -27.57% | -4.07% |
| FCF Growth (5Y CAGR) ⓘ | N/A | 4.96% |
| DPS Growth (5Y CAGR) ⓘ | 19.61% | 8.79% |
Quality (Business durability) | ||
| ROIC (Latest) ⓘ | 2.12% | 9.60% |
| ROE (Latest) ⓘ | 16.52% | 13.84% |
| ROA (Latest) ⓘ | 2.40% | 1.53% |
| ROIC (5Y Median) ⓘ | 9.95% | 7.86% |
| ROE (5Y Median) ⓘ | 6.79% | 12.20% |
| ROA (5Y Median) ⓘ | 1.22% | 1.29% |
| Net Debt / EBIT (Latest) ⓘ | -0.01 | 0.91 |
| Net Debt / EBIT (5Y Median) ⓘ | 2.44 | 0.74 |
| Net Debt / EBITDA (Latest) ⓘ | -0.01 | 0.97 |
| Operating Margin (Latest) ⓘ | 10.03% | 22.12% |
| Operating Margin (5Y Median) ⓘ | 35.61% | 24.39% |
| Debt to Equity (Latest) ⓘ | 348.15% | 60.37% |
| Profit Margin (Latest) ⓘ | 10.72% | 26.62% |
| Free Cash Flow (Latest) ⓘ | $1.78B | |
Momentum (Price trend) | ||
| 3Y Return ⓘ | +37.37% | +89.23% |
| 12M Return (excl. last month) ⓘ | -17.42% | +17.35% |
| 6M Return ⓘ | +11.06% | +10.00% |
| Price vs. 200-Day MA ⓘ | -13.13% | +3.73% |
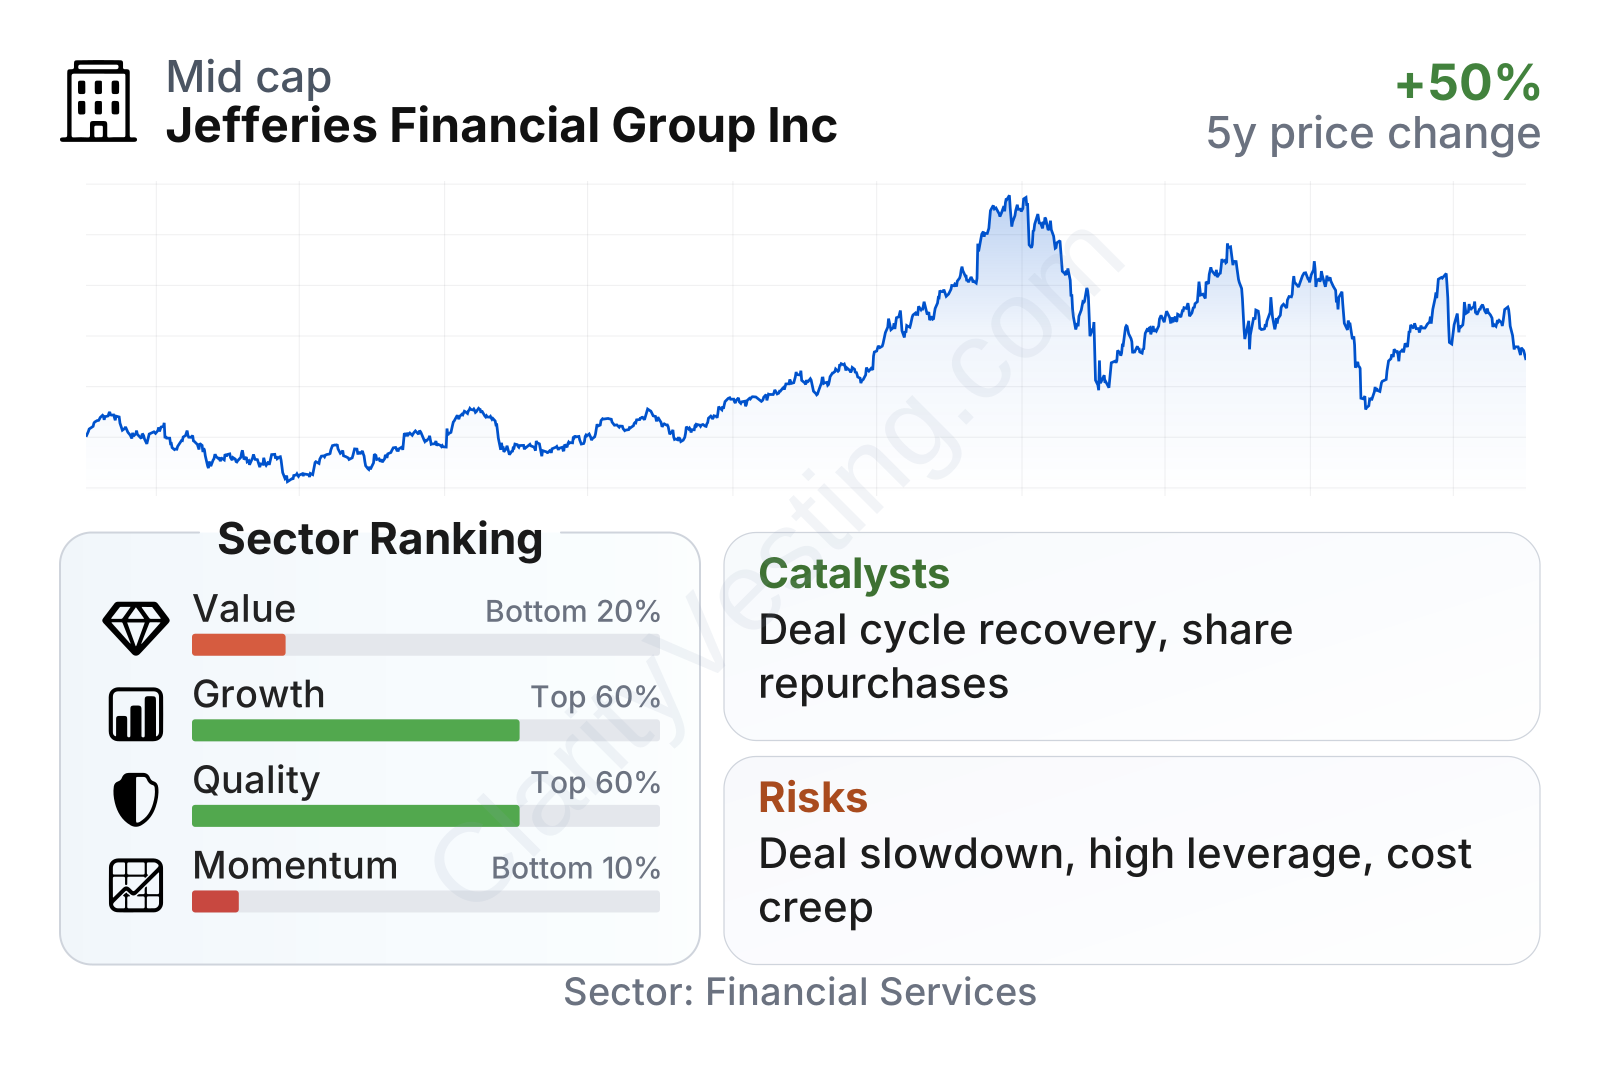
Jefferies sits in the middle of the pack on valuation, with earnings multiples close to the sector median and a price-to-book ratio modestly below the sector median. Cash generation looks comparatively strong, and the dividend yield is slightly above the sector norm. Growth metrics are mixed: recent revenue growth has been strong, but the longer-term trend in earnings and margins has been less consistent. Quality indicators are also mixed, with current returns on equity and assets now above the sector median, while leverage remains much higher than is typical in the broader financial sector. Share price momentum has been weak versus peers, reflecting how sensitive sentiment around investment banks can be.
Jefferies is a mid-sized capital markets firm, not a giant universal bank. Its beta around 1.5 also signals that the stock tends to move more sharply than the overall market, which fits the cyclical nature of its business.
Growth
Jefferies operates in a sector that should remain structurally important over time. Companies will continue to need advice on acquisitions, restructurings, equity offerings, and debt financing. Trading and market-making are also deeply embedded in global capital markets. That said, this is not a smooth growth industry. Activity can be very strong when confidence, valuations, and financing conditions are supportive, and much weaker when markets become uncertain.
Jefferies’ strategy makes sense if the goal is to build a scaled independent investment bank without the complexity of a giant commercial bank. It has spent years broadening industry coverage, adding senior bankers, strengthening its underwriting franchise, and keeping a global platform that can compete for large mandates. Its independent model can appeal to clients that want a major advisory and capital markets firm without going directly to the largest money-center banks.
A key catalyst is the health of the deal cycle. If merger activity, initial public offerings, and leveraged finance issuance continue to recover from recent trough levels, Jefferies has meaningful operating leverage because higher fee revenue can improve profitability quickly once fixed costs are covered. Another catalyst is its merchant banking and investment portfolio, which can add value when asset realizations occur at favorable prices.
Earnings per share show why Jefferies needs a long-term lens. Results surged in the unusually strong 2021 environment, then dropped sharply during the weaker deal backdrop, and have only partly recovered. That pattern is typical of cyclical capital markets firms: revenue opportunity can return quickly, but earnings are rarely linear.
Book value per share has trended upward over the past five years, which is important for a financial company because book value is a rough measure of the capital base supporting the business. The growth rate has not been exceptional, but it does indicate that Jefferies has continued to build underlying equity through the cycle rather than merely treading water.
Recent company communications have also pointed to ongoing share repurchases and continued investment in franchise expansion. In a favorable market backdrop, that combination can support per-share growth even if industry volumes do not return all the way to the 2021 peak.
Risks
This article is for informational purposes only and does not constitute financial advice. Some content is AI-generated. See Disclaimer