Stock Analysis · JD Sports Fashion PLC (JDSPY)
Overview
JD Sports Fashion PLC is a global sports-fashion retailer that sells branded athletic footwear, apparel, and accessories through stores and digital channels. The group is best known for the JD banner in the United Kingdom and Europe, but it also operates several other retail formats and has a meaningful presence in North America. Its positioning sits between sportswear and fashion: the company focuses on popular global brands such as Nike, adidas, Puma, and The North Face, while using store presentation, product launches, and limited-edition ranges to attract younger customers.
The business makes most of its money from retail sales of third-party branded products, with footwear typically the largest product category across the group. Based on the company’s recent annual reporting structure, revenue is mainly split by geography rather than by detailed product line, and the mix is approximately as follows:
- North America: about 39% of revenue. This includes store and online sales in the United States and Canada, largely from sports-fashion retail banners acquired over time.
- Europe: about 33% of revenue. This includes continental European JD stores and related digital operations.
- United Kingdom: about 26% of revenue. This is the group’s historic core market and includes the flagship JD chain.
- Asia Pacific: about 2% of revenue. This is still a small contributor but gives the company a platform in faster-growing international markets.
In practical terms, JD Sports is primarily a retailer of sneakers and sports-inspired clothing rather than a brand owner. That matters because growth depends on store execution, e-commerce, inventory discipline, and continued access to high-demand products from major suppliers.
Over the last five fiscal years, group revenue has risen from roughly £8.6 billion to about £12.7 billion, while gross profit also expanded steadily. The broad pattern is positive at the top line, although earnings have been less smooth because costs, interest expense, and margin pressure have moved around more than sales.
The operating picture shows a business that has scaled meaningfully, with revenue and gross profit growing year after year. At the same time, a larger cost base and higher interest expense have kept net income from rising as consistently as sales.
Key Figures
| Metric | Value | Sector ⓘ |
|---|---|---|
| Date | Oct 24, 2026 | |
| Context | ||
| Sector | Consumer Cyclical | |
| Industry | Apparel Retail | |
| Market Cap ⓘ | $5.54B | |
| Beta ⓘ | 1.62 | |
Value (Cheapness) | ||
| P/E Ratio ⓘ | 7.87 | 17.09 |
| P/B Ratio ⓘ | 2.27 | 1.64 |
| FCF Yield ⓘ | 34.57% | 8.68% |
| Dividend Yield ⓘ | 1.34% | 2.70% |
| EBIT / EV ⓘ | N/A | 6.69% |
| PEG ⓘ | 0.97 | |
Growth (Business expansion) | ||
| Revenue Growth ⓘ | -0.70% | 5.60% |
| RPS Growth (5Y CAGR) ⓘ | 10.52% | 9.01% |
| EPS Growth (5Y CAGR) ⓘ | 12.85% | -17.32% |
| BVPS Growth (5Y CAGR) ⓘ | 7.50% | 5.64% |
| Margin Growth (5Y Trend) ⓘ | -0.79% | -0.17% |
| FCF Growth (5Y CAGR) ⓘ | -1.20% | 5.02% |
| DPS Growth (5Y CAGR) ⓘ | 35.96% | 10.19% |
Quality (Business durability) | ||
| ROIC (Latest) ⓘ | 40.07% | 12.46% |
| ROA (Latest) ⓘ | 10.72% | 5.50% |
| ROIC (5Y Median) ⓘ | 21.17% | 10.68% |
| ROA (5Y Median) ⓘ | 5.44% | 5.44% |
| Net Debt / EBIT (Latest) ⓘ | 1.52 | 2.16 |
| Net Debt / EBIT (5Y Median) ⓘ | 1.68 | 2.29 |
| Net Debt / EBITDA (Latest) ⓘ | 0.77 | 1.48 |
| Net Debt / Assets ⓘ | 29.36% | 21.74% |
| EBITDA / Interest ⓘ | 8.71 | 9.17 |
| Operating Margin (Latest) ⓘ | 7.74% | 9.08% |
| Operating Margin (5Y Median) ⓘ | 7.63% | 9.56% |
| Debt to Equity (Latest) ⓘ | 120.10% | 75.99% |
| Profit Margin (Latest) ⓘ | 4.45% | 5.30% |
| Free Cash Flow (Latest) ⓘ | $1.92B | |
Momentum (Price trend) | ||
| 3Y Return ⓘ | -18.75% | +19.94% |
| 12M Return (excl. last month) ⓘ | -18.06% | -4.14% |
| 6M Return ⓘ | +17.33% | -3.03% |
| Price vs. 200-Day MA ⓘ | +14.04% | -0.66% |
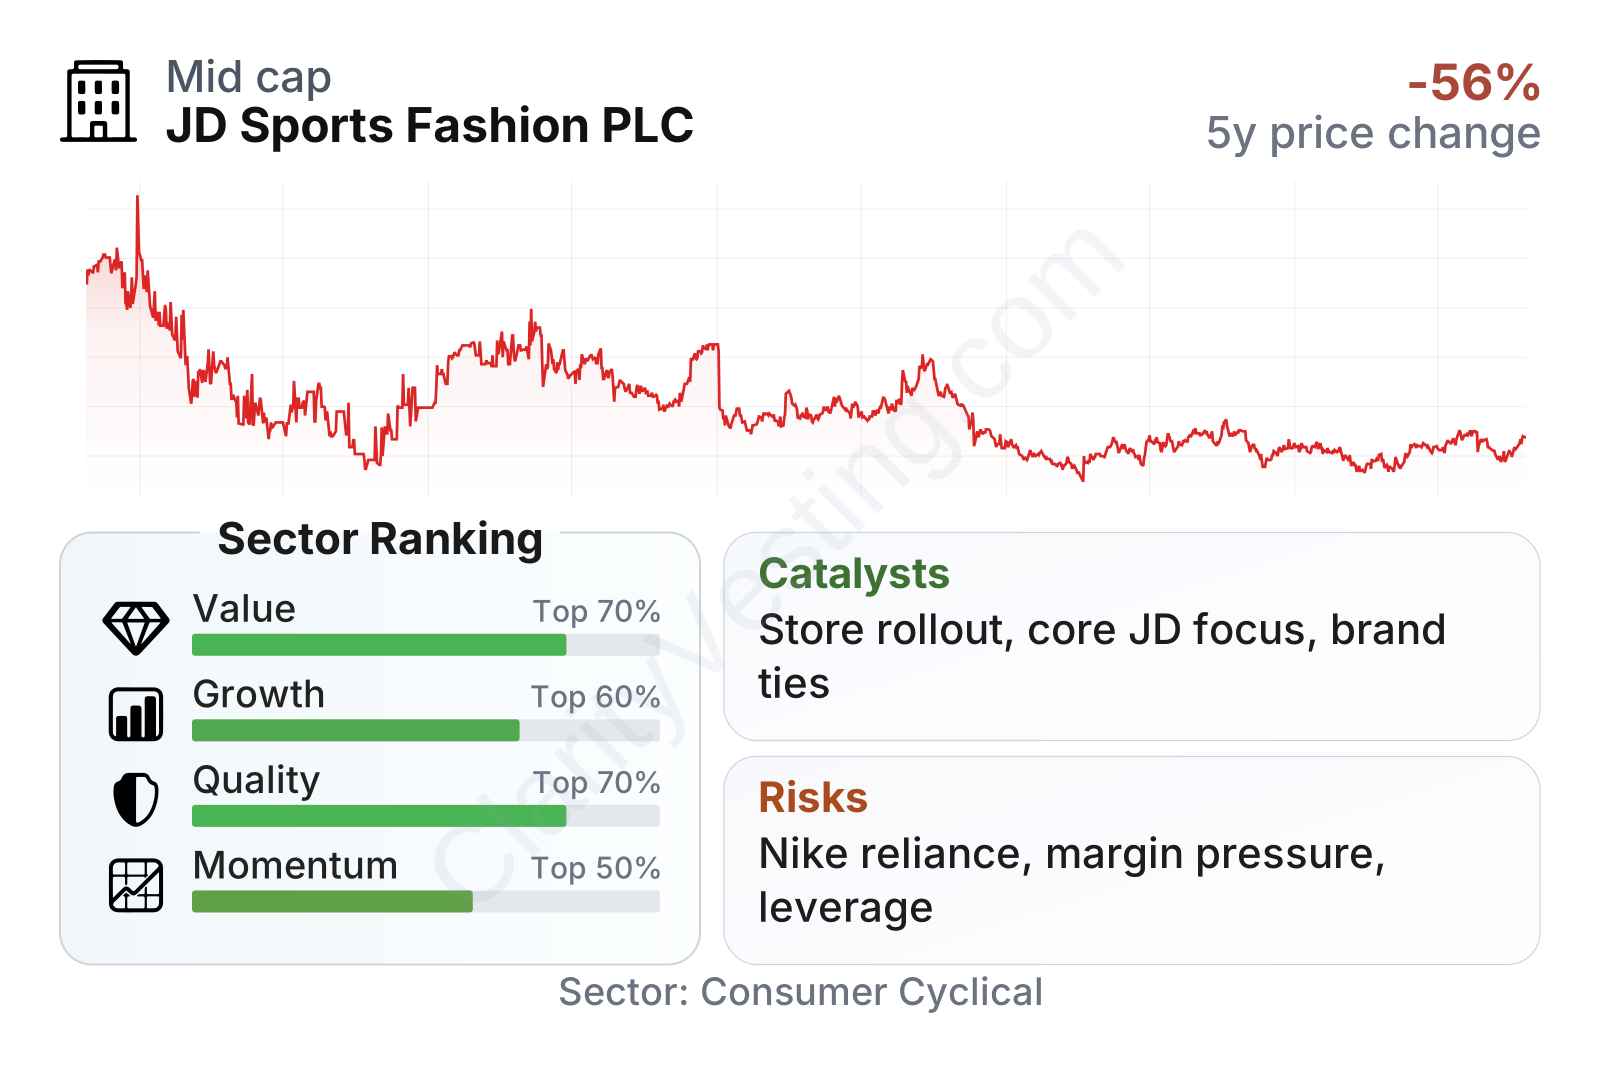
JD Sports currently sits in an unusual position: the market valuation looks low relative to much of the consumer discretionary sector, while profitability and returns on capital remain solid. The earnings multiple is well below the sector median, and free cash flow generation is notably strong. Quality metrics are also respectable, with return on invested capital clearly above the sector median and net debt relative to earnings below many peers.
At the same time, the table also points to why the share price has been weak over a longer period. Recent revenue growth has been soft, operating margins trail the sector median, and free cash flow growth over five years has not matched the broader peer group. The stock’s recent six-month rebound stands out, but it follows a much weaker three-year share-price path.
The stock has also been volatile. Its beta is above 1.5, which means price swings have tended to be larger than the overall market. For a retail business tied to consumer demand, that is consistent with the company’s exposure to shifts in spending, promotions, and supplier relationships.
Growth
JD Sports operates in a segment with long-term structural support. Athletic footwear and sports-inspired casualwear have benefited for years from lifestyle changes, looser dress codes, health and wellness trends, and the blending of sportswear into everyday fashion. This does not mean straight-line growth every year, but it does mean the company participates in a category that has remained relevant across age groups and regions.
Its strategy is broadly coherent for future expansion. The company has built scale in premium sports-fashion retail, expanded internationally, and kept a multichannel model that combines physical stores with digital sales. That combination matters because sneakers and apparel often benefit from both store traffic and online convenience. The company also continues to invest in larger flagship stores, upgraded locations, and selective international rollout, which can strengthen brand visibility with consumers and supplier partners.
One important growth driver is its relationship with major global brands. Retailers that can showcase launches well, manage inventory tightly, and maintain strong store productivity are better placed to secure sought-after product allocations. JD Sports has historically been strong in presentation and store execution, which helps it stand out in a crowded retail field.
Another useful sign is the longer-term record in per-share growth. Even with a recent slowdown, five-year revenue per share growth is above the sector median, and five-year earnings per share growth remains positive in a sector where many peers have had a far weaker earnings record. That suggests the company has built real scale over time, even if the near-term environment has become more demanding.
Recent company updates have also highlighted continued store openings, investment in international markets, and efforts to simplify the portfolio around the core JD brand. If executed well, that can improve focus, reduce complexity, and concentrate capital on the strongest retail concept in the group.
Risks
This article is for informational purposes only and does not constitute financial advice. Some content is AI-generated. See Disclaimer


