Stock Analysis · Jefferson Capital Inc (JCAP)
Overview
Jefferson Capital Inc is a specialty financial services company focused on consumer debt purchasing and collections. In simple terms, it buys charged-off consumer receivables from banks, credit card issuers, fintech lenders, and other originators at a discount, then works to collect more than it paid over time. The company also provides related servicing capabilities, including legal collections, customer account management, and data-driven recovery operations. Its business is built around underwriting portfolios of unpaid consumer accounts, pricing them carefully, and converting collections into cash flow over several years.
The company’s revenue base is concentrated in one core activity: collections on purchased consumer receivables. Based on company filings, the business is primarily tied to U.S. and international charged-off consumer accounts, with credit card balances representing an important exposure within the broader mix. Precise segment percentages are not always broken out in a simple retail-investor format, but the available disclosures indicate a business model dominated by purchased debt collections rather than a diversified set of unrelated fee businesses.
The main revenue sources can be summarized as follows:
- Collections on purchased receivables: approximately more than 85% of economic activity, generated as Jefferson Capital recovers cash from consumer accounts it has acquired at a discount.
- Changes in expected recoveries and portfolio performance: a meaningful secondary driver, as accounting results can rise or fall when the company updates collection expectations on portfolios it already owns.
- Other servicing and related income: a smaller contribution, coming from operational support activities tied to account management and collections infrastructure.
The business has scaled quickly in recent years. Revenue expanded strongly from 2023 to 2025, and operating income increased even faster, showing the power of a debt-purchasing model when pricing, collections, and funding conditions all cooperate. At the same time, interest expense also became a much larger line item, which matters because this type of business relies heavily on access to capital.
The operating picture has improved sharply over the last three years: revenue rose from roughly $323 million in 2023 to more than $613 million in 2025, while operating income nearly tripled. That points to successful portfolio purchasing and solid collection execution, although the jump in interest expense also shows that growth has come with a heavier financing burden.
Key Figures
| Metric | Value | Sector ⓘ |
|---|---|---|
| Date | Oct 17, 2026 | |
| Context | ||
| Sector | Financial Services | |
| Industry | Credit Services | |
| Market Cap ⓘ | $1.17B | |
| Beta ⓘ | N/A | |
Value (Cheapness) | ||
| P/E Ratio ⓘ | 22.56 | 12.26 |
| P/B Ratio ⓘ | 2.42 | 1.23 |
| FCF Yield ⓘ | 18.88% | 10.40% |
| Dividend Yield ⓘ | 2.34% | 3.02% |
| EBIT / EV ⓘ | 10.25% | 8.14% |
| PEG ⓘ | N/A | |
Growth (Business expansion) | ||
| Revenue Growth ⓘ | 11.50% | 9.35% |
| RPS Growth (5Y CAGR) ⓘ | 41.45% | 12.19% |
| EPS Growth (5Y CAGR) ⓘ | N/A | -9.53% |
| BVPS Growth (5Y CAGR) ⓘ | -9.40% | 4.99% |
| Margin Growth (5Y Trend) ⓘ | -128.21% | -3.86% |
| FCF Growth (5Y CAGR) ⓘ | N/A | 4.81% |
| DPS Growth (5Y CAGR) ⓘ | 2.59% | 8.79% |
Quality (Business durability) | ||
| ROIC (Latest) ⓘ | 11.05% | 9.49% |
| ROE (Latest) ⓘ | 33.94% | 13.90% |
| ROA (Latest) ⓘ | 7.98% | 1.55% |
| ROIC (5Y Median) ⓘ | N/A | 7.86% |
| ROE (5Y Median) ⓘ | 25.82% | 12.17% |
| ROA (5Y Median) ⓘ | 10.05% | 1.30% |
| Net Debt / EBIT (Latest) ⓘ | 5.44 | 0.96 |
| Net Debt / EBIT (5Y Median) ⓘ | 5.14 | 0.73 |
| Net Debt / EBITDA (Latest) ⓘ | 5.36 | 0.92 |
| Operating Margin (Latest) ⓘ | 38.59% | 22.30% |
| Operating Margin (5Y Median) ⓘ | 52.87% | 24.63% |
| Debt to Equity (Latest) ⓘ | 295.22% | 58.56% |
| Profit Margin (Latest) ⓘ | 24.12% | 26.57% |
| Free Cash Flow (Latest) ⓘ | $220.06M | |
Momentum (Price trend) | ||
| 3Y Return ⓘ | N/A | +88.33% |
| 12M Return (excl. last month) ⓘ | +23.95% | +19.38% |
| 6M Return ⓘ | +2.26% | +4.75% |
| Price vs. 200-Day MA ⓘ | +5.17% | +3.50% |
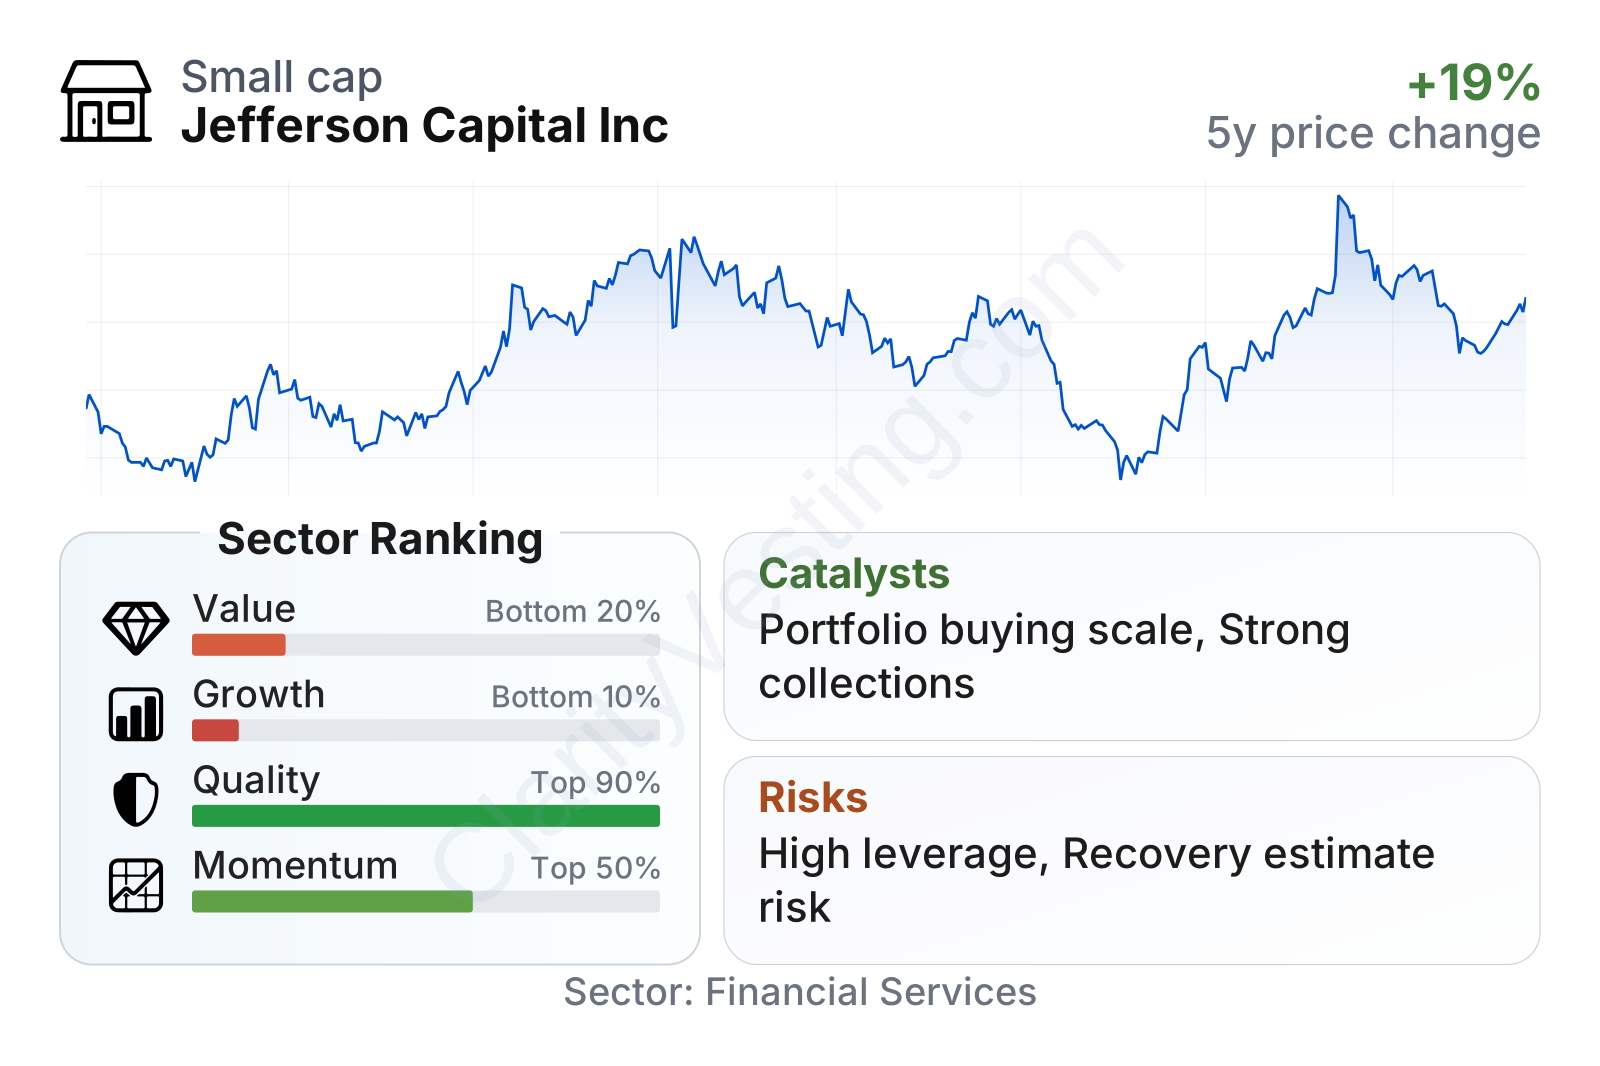
Jefferson Capital stands out for profitability and cash generation more than for balance-sheet conservatism or market momentum. The company ranks very well on quality metrics, with returns on equity and assets far above sector medians and operating margins clearly stronger than many peers. Free cash flow generation also looks robust. On the other hand, growth signals are mixed despite strong top-line expansion, partly because margin trends and book value compounding have been uneven over the full comparison period. The market is also assigning a very low earnings multiple while keeping the price-to-book ratio above the sector median, which suggests investors view current earnings as strong but are still cautious about how durable they are.
Share performance has been volatile over the last year and a half. After a sharp rise late in 2025, the stock pulled back and then stabilized around the high teens. That pattern fits a company where sentiment can move quickly with portfolio purchases, financing costs, and quarterly collection performance.
Growth
Jefferson Capital operates in a niche that can grow when consumer credit volumes increase and lenders continue selling charged-off accounts to specialized buyers. This is not a fast-moving technology market, but it is a scalable financial services segment with recurring deal flow. As long as banks, card issuers, and fintech lenders want to clean up delinquent balances and free up capital, firms with strong underwriting and collection capabilities can keep finding new supply.
The company’s strategy is logical for future growth. It is centered on buying receivable portfolios, using analytics to estimate recoveries, and running collections through an established platform. That model can produce attractive returns if management remains disciplined on pricing and funding. Jefferson Capital’s recent revenue growth, along with unusually high returns on assets and equity, suggests the platform has been working effectively. Its relatively small size compared with large financial institutions can also help it remain focused in this specialized market.
Earnings per share remain elevated after the company’s strong 2025 performance, even though the pace appears less explosive in 2026 than at the prior peak. For long-term analysis, the key point is not only the high earnings base but whether Jefferson Capital can sustain strong portfolio returns as it keeps deploying capital.
Book value per share rose dramatically through 2025, reflecting the company’s profit generation and changing capital structure after becoming publicly listed. That is an encouraging sign because book value matters in credit-focused businesses: it represents the equity base supporting future portfolio purchases and absorbing volatility. If book value keeps compounding from here, it would support the case that recent gains were not just a short-term spike.
A notable catalyst is the company’s ability to keep buying portfolios at attractive returns while many originators remain active sellers of charged-off consumer debt. Another is operating leverage: once the collections platform is built, incremental volume can lift earnings meaningfully if collection efficiency stays strong. Recent company communications have also highlighted continued purchasing activity and servicing scale, which supports the view that Jefferson Capital is still in expansion mode rather than simply harvesting an old book.
Risks
This article is for informational purposes only and does not constitute financial advice. Some content is AI-generated. See Disclaimer


