Stock Analysis · JB Hunt Transport Services Inc (JBHT)
Overview
JB Hunt Transport Services is one of the largest freight transportation and logistics companies in North America. It helps shippers move goods across the United States, Canada, and Mexico by combining trucking, rail, brokerage, final-mile delivery, and dedicated fleet services. In simple terms, the company is a transportation organizer and operator: sometimes it uses its own trucks and drivers, and sometimes it coordinates third-party capacity to match freight demand with available transportation.
The business is built around several operating segments, with intermodal remaining the largest. Intermodal means freight is moved in containers using a combination of rail and truck, which is usually more fuel-efficient and cost-effective than moving the full route by highway. JB Hunt has long-standing relationships in this area, especially with major rail partners, and that gives it an important role in domestic container transportation.
Based on recent annual reporting, revenue is mainly generated from the following activities:
- Intermodal (JBI): about 52% of total revenue. This includes moving freight in containers using rail for the long haul and trucks for pickup and delivery.
- Dedicated Contract Services (DCS): about 27%. This segment provides customer-specific fleets, drivers, and equipment under multi-year contracts.
- Integrated Capacity Solutions (ICS): about 14%. This is the brokerage business, where JB Hunt arranges shipments using third-party carriers.
- Final Mile Services (FMS): about 5%. This covers delivery of large or heavy products to homes or businesses, often including scheduled delivery and installation-related coordination.
- Truckload (JBT): about 2%. This is the traditional full-truckload business using company-operated tractors and trailers.
That mix matters because it gives JB Hunt exposure to multiple parts of the freight market rather than relying on a single service line. It also means results can be supported by more stable contract businesses such as dedicated fleets when spot freight markets are weak. Over the last few years, however, the company’s revenue and earnings have moved with the broader freight cycle, showing strong results in the 2021-2022 upcycle and a visible slowdown afterward before signs of recovery emerged in 2026.
The long-term picture shows a cyclical business with high operating costs and relatively thin margins, which is normal in transportation. Revenue stayed near the $12 billion range after peaking above that level in 2022, while profit narrowed from the cycle high. The encouraging point is that earnings remained positive throughout the downturn and cash generation improved meaningfully more recently.
Key Figures
| Metric | Value | Sector ⓘ |
|---|---|---|
| Date | Oct 19, 2026 | |
| Context | ||
| Sector | Industrials | |
| Industry | Integrated Freight & Logistics | |
| Market Cap ⓘ | $21.49B | |
| Beta ⓘ | 1.31 | |
Value (Cheapness) | ||
| P/E Ratio ⓘ | 32.27 | 22.10 |
| P/B Ratio ⓘ | 5.96 | 1.97 |
| FCF Yield ⓘ | 5.12% | 6.42% |
| Dividend Yield ⓘ | N/A | 1.94% |
| EBIT / EV ⓘ | 3.48% | 4.79% |
| PEG ⓘ | 1.69 | |
Growth (Business expansion) | ||
| Revenue Growth ⓘ | 19.40% | 9.30% |
| RPS Growth (5Y CAGR) ⓘ | 1.85% | 7.81% |
| EPS Growth (5Y CAGR) ⓘ | -14.03% | -13.06% |
| BVPS Growth (5Y CAGR) ⓘ | 5.69% | 6.14% |
| Margin Growth (5Y Trend) ⓘ | -1.39% | 0.88% |
| FCF Growth (5Y CAGR) ⓘ | 36.08% | 11.01% |
| DPS Growth (5Y CAGR) ⓘ | 10.66% | 9.41% |
Quality (Business durability) | ||
| ROIC (Latest) ⓘ | 14.02% | 10.84% |
| ROA (Latest) ⓘ | 8.33% | 5.41% |
| ROIC (5Y Median) ⓘ | 22.46% | 9.38% |
| ROA (5Y Median) ⓘ | 8.80% | 4.95% |
| Net Debt / EBIT (Latest) ⓘ | 1.21 | 2.08 |
| Net Debt / EBIT (5Y Median) ⓘ | 1.87 | 2.27 |
| Net Debt / EBITDA (Latest) ⓘ | 0.68 | 1.40 |
| Net Debt / Assets ⓘ | 13.85% | 19.29% |
| EBITDA / Interest ⓘ | 25.91 | 9.56 |
| Operating Margin (Latest) ⓘ | 6.94% | 10.50% |
| Operating Margin (5Y Median) ⓘ | 7.80% | 10.29% |
| Debt to Equity (Latest) ⓘ | 30.93% | 65.48% |
| Profit Margin (Latest) ⓘ | 5.31% | 6.67% |
| Free Cash Flow (Latest) ⓘ | $1.10B | |
Momentum (Price trend) | ||
| 3Y Return ⓘ | +20.14% | +61.68% |
| 12M Return (excl. last month) ⓘ | +73.20% | +12.58% |
| 6M Return ⓘ | -3.66% | 0.00% |
| Price vs. 200-Day MA ⓘ | -6.42% | 0.00% |
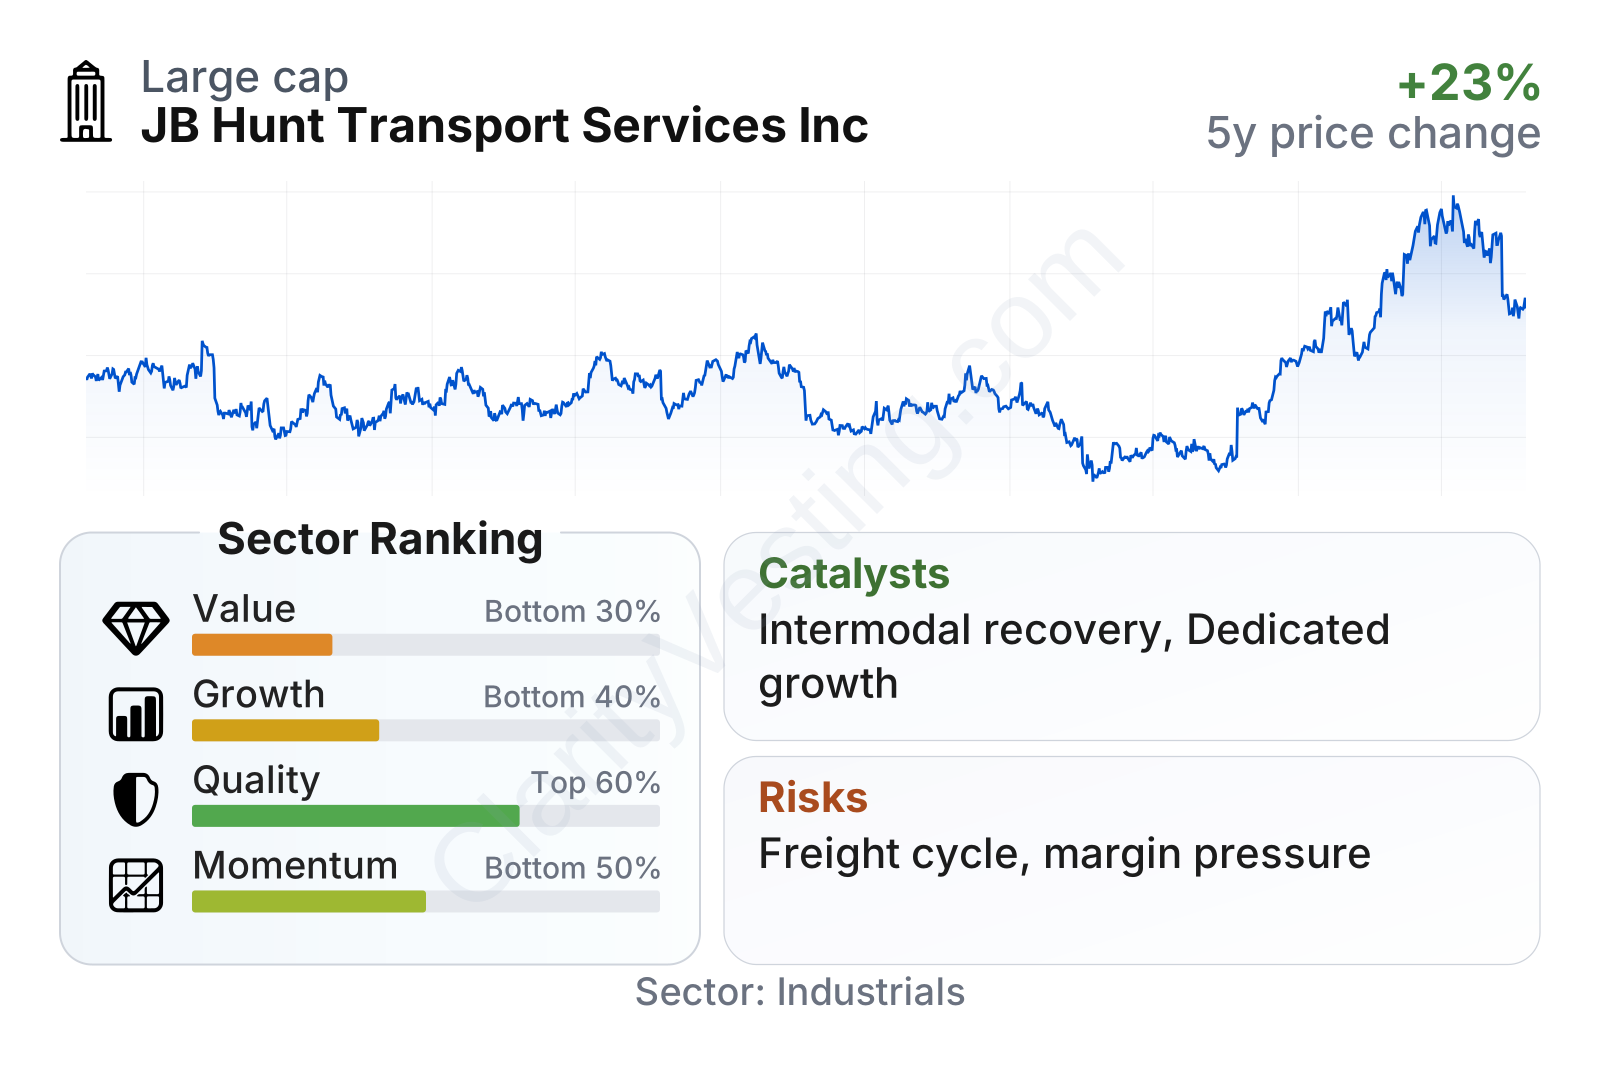
JB Hunt is a large transportation company with above-average balance sheet strength and returns on capital, but its current market multiples sit above sector norms. Quality metrics are solid: returns on assets and invested capital are better than many industry peers, while leverage remains moderate. Growth is more mixed. Recent revenue growth has improved sharply after a weak freight period, yet five-year earnings trends and margin trends still reflect the industry downturn. Share price performance has been very strong over the last year, but shorter-term momentum has cooled after that rally.
Growth
JB Hunt operates in a sector that should keep growing over the long run because economies continue to depend on freight movement, supply chain outsourcing, and time-sensitive delivery. The most attractive part of that backdrop is not simple trucking volume alone, but the increasing need for integrated logistics networks that can combine cost, speed, visibility, and flexibility. That plays directly into JB Hunt’s model, especially in intermodal, dedicated services, and brokerage supported by technology.
The company’s strategy makes sense for long-term expansion because it is not just adding trucks; it is trying to deepen its role inside customer supply chains. Dedicated Contract Services can grow when shippers want more predictable capacity and service levels. Intermodal can benefit when customers shift freight from highway to rail to lower transportation costs and reduce emissions. Brokerage and digital freight matching can grow when customers prefer a single platform that can access multiple transportation options.
Revenue trends suggest that the freight cycle has likely moved off the bottom. After a long stretch of year-over-year declines through 2023, 2024, and much of 2025, growth turned positive again in 2026 and then accelerated into the high-teens to low-20% range. That kind of rebound usually points to improving shipment volumes, better pricing, or both. It does not remove cyclicality, but it does indicate that business conditions have become more favorable than they were during the prior downturn.
Cash generation has improved even more clearly than revenue. Free cash flow moved from very low levels earlier in the period to more than $1 billion on a trailing basis by 2026. For a capital-intensive transportation company, that is important because it creates room for fleet investment, technology spending, dividends, and share repurchases without leaning heavily on debt.
One major catalyst is the intermodal franchise. JB Hunt’s scale in domestic containers and its rail relationships give it leverage if shippers continue shifting freight away from long-haul trucking. Another is dedicated fleet outsourcing, where customers often choose reliability and capacity assurance over the uncertainty of the spot market. The company has also continued to invest in its technology platform, including tools that connect shippers and carriers more efficiently. In a fragmented freight market, that can help widen customer relationships and improve asset utilization.
Recent company communications have also highlighted continued demand for dedicated capacity and network efficiency initiatives. If freight demand continues recovering and pricing becomes firmer, JB Hunt is positioned to participate across several service lines rather than depending on one narrow recovery theme.
Risks
This article is for informational purposes only and does not constitute financial advice. Some content is AI-generated. See Disclaimer


