Stock Analysis · Jacobs Solutions Inc (J)
Overview
Jacobs Solutions Inc is an engineering, consulting, and project delivery company that works on complex infrastructure and government-related programs. In simple terms, it helps governments, utilities, manufacturers, and other large organizations design, modernize, build, operate, and secure important systems. Its work spans water networks, environmental remediation, transportation, life sciences facilities, advanced manufacturing, data centers, cyber programs, and national security missions.
The company has changed meaningfully over the past several years. It has moved away from lower-margin, more traditional construction exposure and toward consulting, technical services, software-enabled solutions, and highly specialized government and infrastructure work. That matters for long-term analysis because these activities usually depend more on expertise and long customer relationships than on commodity-like project bidding alone.
Based on recent company reporting, Jacobs’ revenue mix is centered on two main business lines.
- Infrastructure & Advanced Facilities: approximately 55% to 60% of revenue. This includes water and wastewater programs, transportation, environmental work, advanced manufacturing, semiconductors, life sciences, energy transition-related facilities, and data center-related projects.
- PA Consulting: approximately 40% to 45% of revenue. This business focuses on higher-value advisory and transformation services, including strategy, digital, operations improvement, innovation, and implementation work for both public and private sector clients.
Another useful lens is customer exposure. A large share of Jacobs’ activity comes from public-sector and regulated end markets such as defense, intelligence, water, and transportation, while the rest comes from private-sector clients in areas like pharmaceuticals, clean technology, and advanced manufacturing. That mix gives the company some resilience because many of its projects are tied to multi-year spending plans rather than short-term consumer demand.
The profit flow over the last several years shows steady revenue expansion from the post-2022 base, with gross profit also rising. However, the earnings picture has been less smooth than sales growth alone would suggest, especially in the most recent annual period, where net income dropped sharply despite higher revenue. That gap suggests the core question is not whether Jacobs can win work, but whether it can convert that work into durable margins and cash generation.
Key Figures
| Metric | Value | Sector ⓘ |
|---|---|---|
| Date | Oct 03, 2026 | |
| Context | ||
| Sector | Industrials | |
| Industry | Engineering & Construction | |
| Market Cap ⓘ | $15.97B | |
| Beta ⓘ | 0.68 | |
Value (Cheapness) | ||
| P/E Ratio ⓘ | 45.80 | 22.45 |
| P/B Ratio ⓘ | 4.91 | 1.98 |
| FCF Yield ⓘ | 4.04% | 6.31% |
| Dividend Yield ⓘ | 0.98% | 1.96% |
| EBIT / EV ⓘ | 3.46% | 4.81% |
| PEG ⓘ | 0.43 | |
Growth (Business expansion) | ||
| Revenue Growth ⓘ | 34.50% | 9.10% |
| RPS Growth (5Y CAGR) ⓘ | -1.71% | 7.75% |
| EPS Growth (5Y CAGR) ⓘ | -7.32% | -13.59% |
| BVPS Growth (5Y CAGR) ⓘ | -16.59% | 6.22% |
| Margin Growth (5Y Trend) ⓘ | 0.28% | 0.72% |
| FCF Growth (5Y CAGR) ⓘ | -1.04% | 10.98% |
| DPS Growth (5Y CAGR) ⓘ | 1.77% | 9.48% |
Quality (Business durability) | ||
| ROIC (Latest) ⓘ | 6.36% | 10.92% |
| ROA (Latest) ⓘ | 2.91% | 5.41% |
| ROIC (5Y Median) ⓘ | 5.88% | 9.21% |
| ROA (5Y Median) ⓘ | 4.40% | 4.94% |
| Net Debt / EBIT (Latest) ⓘ | 4.29 | 2.07 |
| Net Debt / EBIT (5Y Median) ⓘ | 3.66 | 2.28 |
| Net Debt / EBITDA (Latest) ⓘ | 3.19 | 1.43 |
| Net Debt / Assets ⓘ | 24.54% | 19.27% |
| EBITDA / Interest ⓘ | 5.47 | 9.53 |
| Operating Margin (Latest) ⓘ | 4.72% | 10.50% |
| Operating Margin (5Y Median) ⓘ | 5.90% | 10.27% |
| Debt to Equity (Latest) ⓘ | 124.21% | 65.48% |
| Profit Margin (Latest) ⓘ | 2.38% | 6.62% |
| Free Cash Flow (Latest) ⓘ | $644.54M | |
Momentum (Price trend) | ||
| 3Y Return ⓘ | +23.19% | +58.56% |
| 12M Return (excl. last month) ⓘ | +3.01% | +15.63% |
| 6M Return ⓘ | +6.87% | +4.19% |
| Price vs. 200-Day MA ⓘ | +2.10% | +0.93% |
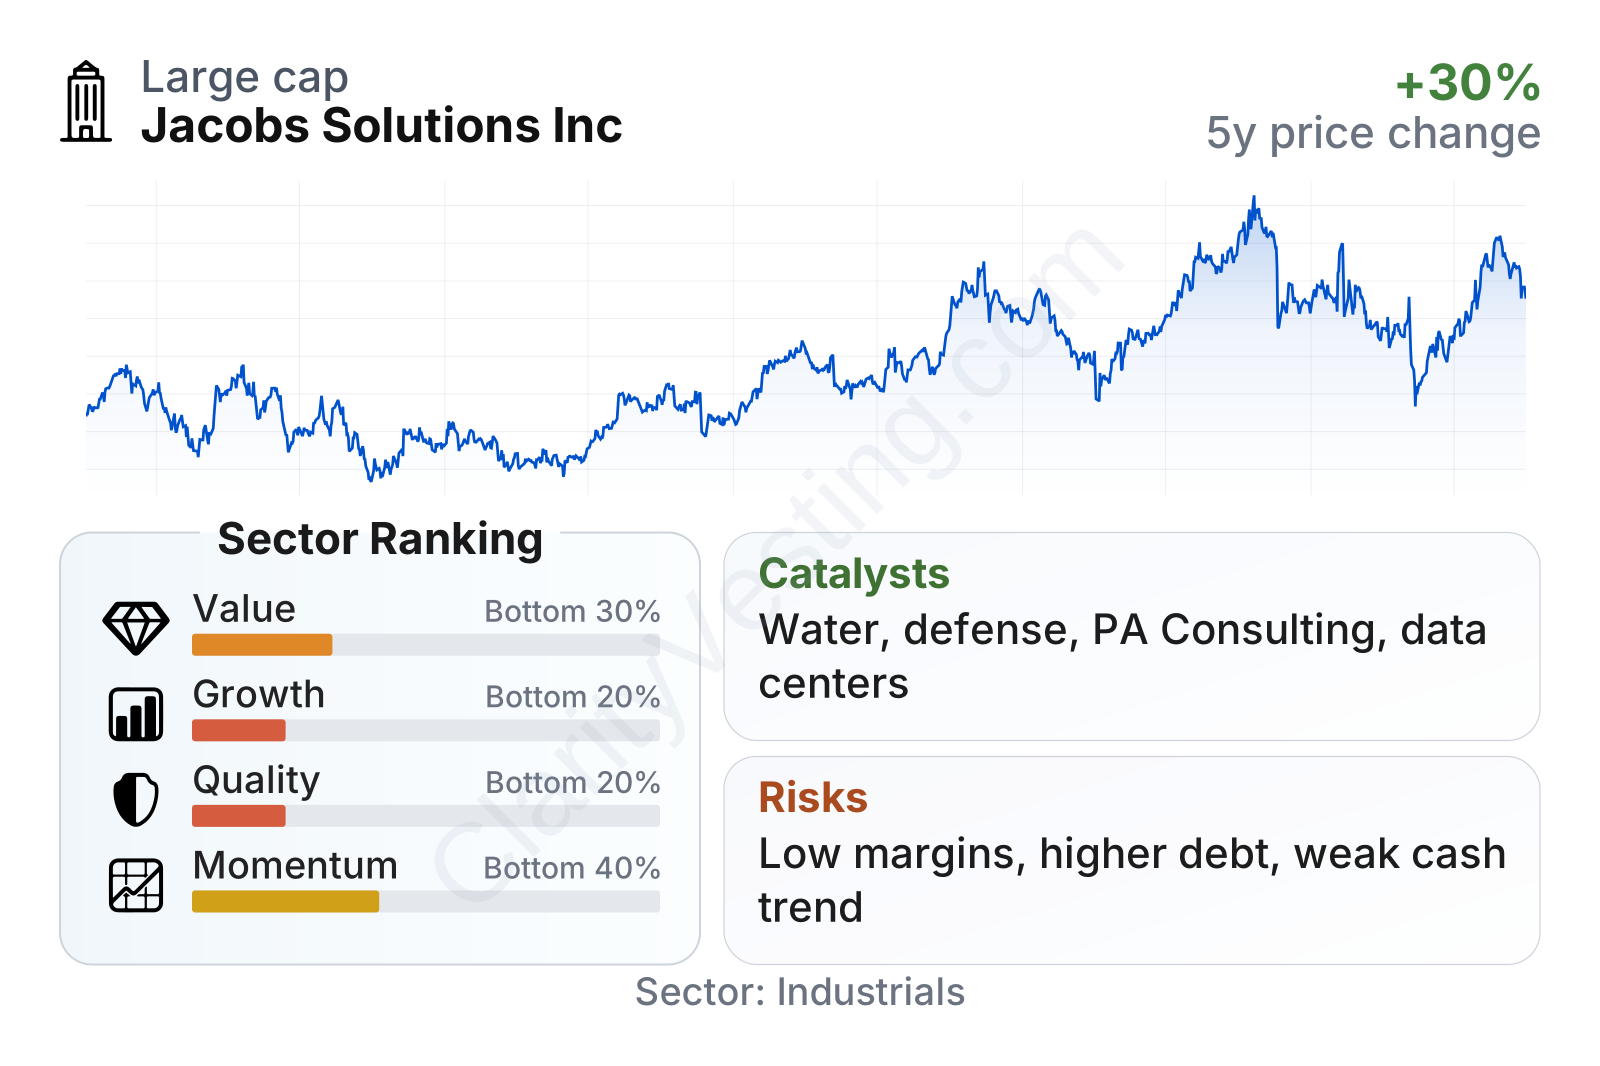
Jacobs is a large engineering and consulting company with a market value in the mid-teens of billions of dollars and a relatively low share-price volatility profile, reflected by a beta below 1. The stock’s factor profile is mixed. Recent revenue growth has been strong, but most other categories rank below the sector median. In particular, valuation looks demanding, while quality measures such as returns on capital, margins, and leverage are weaker than many peers. Momentum is also not especially strong on a multi-year basis, even though shorter-term trading has improved.
The share price has been volatile over the last five years, with a meaningful rise through 2024 and 2025 followed by a pullback in 2026. That pattern fits a company where the market has rewarded the portfolio shift toward higher-value services, but has become more cautious as profitability and balance-sheet metrics weakened.
Growth
Jacobs operates in parts of the economy that have long-duration demand drivers. Water infrastructure needs upgrading in many regions, governments continue to fund defense and critical infrastructure, and private companies are spending on life sciences, semiconductors, advanced manufacturing, and data capacity. These are not niche themes. They are large investment cycles likely to play out over many years.
Its strategy broadly makes sense for future growth. The company has intentionally reshaped itself around consulting, technical solutions, and mission-critical infrastructure rather than depending mainly on traditional lump-sum construction work. That tends to reduce exposure to the most volatile project risks and can support stronger client retention. PA Consulting also adds a more advisory-led capability that can open doors earlier in the customer decision process, before large implementation projects begin.
Recent sales growth has clearly accelerated again after a choppy period. The latest year-over-year growth rate is far above the sector median, which indicates that Jacobs is benefiting from demand in its end markets and possibly from a stronger backlog conversion. Still, the longer five-year growth record is much less impressive on a per-share basis, so the recent rebound needs to be weighed against a more uneven multi-year pattern.
Cash generation is positive, but the trend has been inconsistent. Free cash flow remains meaningful in absolute terms, which is a strength, yet it has moved down from earlier peaks. For a business built around technical services and project execution, consistent cash conversion matters because it helps validate earnings quality and supports debt capacity, acquisitions, and shareholder returns without putting pressure on the balance sheet.
Recent company updates have also pointed to favorable positioning in areas such as water, life sciences, energy and manufacturing modernization, and defense-related technical work. These categories can act as real catalysts because they are linked to structural spending priorities rather than temporary demand surges. The integration of consulting and delivery capabilities is another potential advantage if Jacobs can translate advisory work into larger multi-year programs.
Risks
This article is for informational purposes only and does not constitute financial advice. Some content is AI-generated. See Disclaimer


