Stock Analysis · Illinois Tool Works Inc (ITW)
Overview
Illinois Tool Works Inc. is a diversified industrial manufacturer that sells engineered products, equipment, and consumables used across factories, vehicle production, construction, food service, and specialized industrial applications. The company operates with a decentralized model and focuses on niche markets where it can earn strong margins through product differentiation, customer relationships, and repeat business. A large part of its portfolio is built around small, specialized products rather than one flagship item, which helps reduce dependence on any single end market.
Its revenue comes from seven reporting segments. Based on the latest full-year company reporting, the mix is roughly as follows:
- Automotive OEM: about 19% — components and fasteners, fluids, and related products supplied to vehicle manufacturers.
- Food Equipment: about 16% — commercial cooking, refrigeration, dishwashing, weighing, and kitchen ventilation equipment for restaurants, institutions, and food retailers.
- Construction Products: about 15% — anchors, fasteners, sealants, and other building-related products.
- Test & Measurement and Electronics: about 15% — test instruments, inspection systems, assembly equipment, and electronics-related solutions.
- Welding: about 14% — arc welding equipment, consumables, and related services.
- Polymers & Fluids: about 11% — adhesives, sealants, lubricants, cleaning fluids, and specialty materials.
- Specialty Products: about 10% — a broad group of niche industrial products serving several end markets.
This broad spread matters because it gives Illinois Tool Works exposure to industrial production without tying the company entirely to one cycle. It also supports resilience: weakness in one area can be offset by strength elsewhere, although automotive and general manufacturing conditions still have a meaningful influence on results.
The business profile also stands out for profitability. Over the past several years, revenue has stayed relatively stable in a narrow range while operating income and net income have generally improved, showing that management has been able to protect margins through pricing, simplification, and portfolio discipline rather than relying only on rapid sales expansion.
The flow of revenue into profit highlights an important pattern: sales have been fairly steady, but profit conversion improved noticeably through 2024 before easing somewhat afterward. That points to a company whose investment case depends more on efficiency, margin control, and cash generation than on dramatic top-line expansion.
Key Figures
| Metric | Value | Sector ⓘ |
|---|---|---|
| Date | Oct 03, 2026 | |
| Context | ||
| Sector | Industrials | |
| Industry | Specialty Industrial Machinery | |
| Market Cap ⓘ | $76.06B | |
| Beta ⓘ | 1.00 | |
Value (Cheapness) | ||
| P/E Ratio ⓘ | 24.82 | 22.45 |
| P/B Ratio ⓘ | 25.52 | 1.98 |
| FCF Yield ⓘ | 3.84% | 6.31% |
| Dividend Yield ⓘ | 2.35% | 1.96% |
| EBIT / EV ⓘ | 5.15% | 4.81% |
| PEG ⓘ | 2.51 | |
Growth (Business expansion) | ||
| Revenue Growth ⓘ | 6.10% | 9.10% |
| RPS Growth (5Y CAGR) ⓘ | 4.69% | 7.75% |
| EPS Growth (5Y CAGR) ⓘ | -14.24% | -13.59% |
| BVPS Growth (5Y CAGR) ⓘ | -0.94% | 6.22% |
| Margin Growth (5Y Trend) ⓘ | 2.49% | 0.72% |
| FCF Growth (5Y CAGR) ⓘ | 4.60% | 10.98% |
| DPS Growth (5Y CAGR) ⓘ | 7.20% | 9.48% |
Quality (Business durability) | ||
| ROIC (Latest) ⓘ | 27.81% | 10.92% |
| ROA (Latest) ⓘ | 19.57% | 5.41% |
| ROIC (5Y Median) ⓘ | 28.17% | 9.21% |
| ROA (5Y Median) ⓘ | 19.26% | 4.94% |
| Net Debt / EBIT (Latest) ⓘ | 2.00 | 2.07 |
| Net Debt / EBIT (5Y Median) ⓘ | 1.83 | 2.28 |
| Net Debt / EBITDA (Latest) ⓘ | 1.91 | 1.43 |
| Net Debt / Assets ⓘ | 53.67% | 19.27% |
| EBITDA / Interest ⓘ | 15.36 | 9.53 |
| Operating Margin (Latest) ⓘ | 26.85% | 10.50% |
| Operating Margin (5Y Median) ⓘ | 25.08% | 10.27% |
| Debt to Equity (Latest) ⓘ | 334.97% | 65.48% |
| Profit Margin (Latest) ⓘ | 19.39% | 6.62% |
| Free Cash Flow (Latest) ⓘ | $2.92B | |
Momentum (Price trend) | ||
| 3Y Return ⓘ | +20.02% | +58.56% |
| 12M Return (excl. last month) ⓘ | +6.68% | +15.63% |
| 6M Return ⓘ | +0.09% | +4.19% |
| Price vs. 200-Day MA ⓘ | -2.97% | +0.93% |
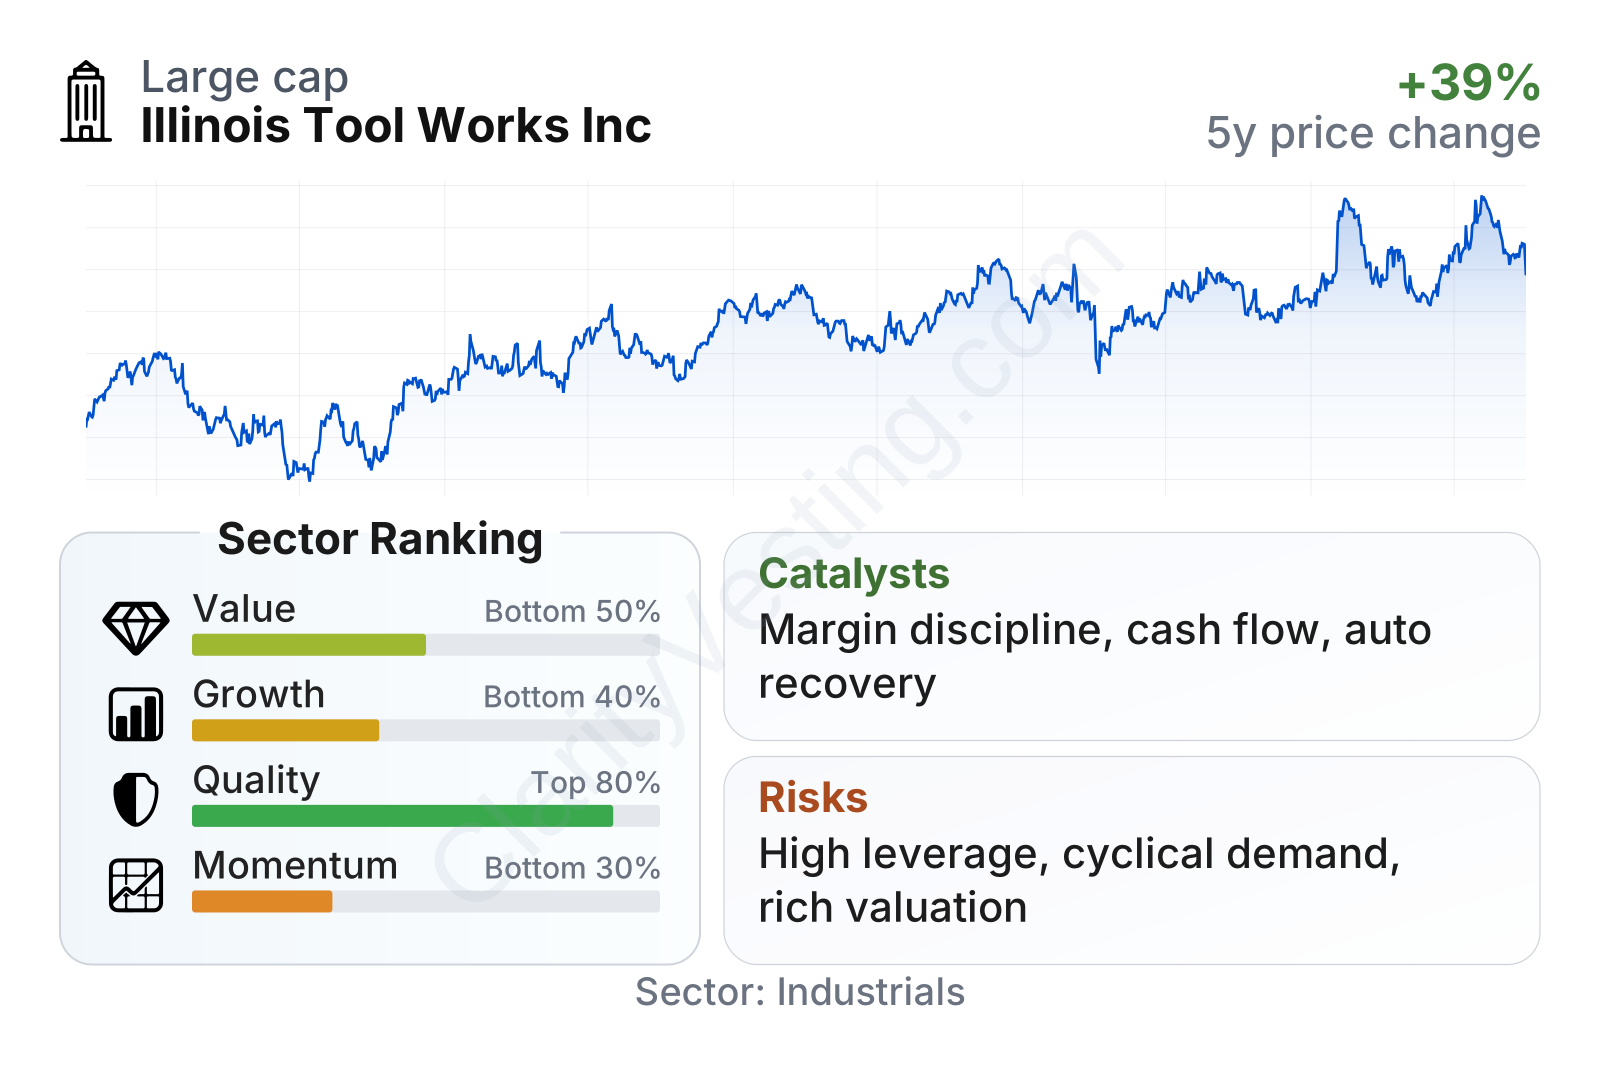
Illinois Tool Works is a large industrial company with market volatility close to the broader market. The overall profile is mixed but understandable: quality remains a clear strength, while value, growth, and longer-term share momentum look less compelling relative to many industrial peers. Profitability measures are well above sector norms, but the stock is not obviously cheap on earnings, cash flow, or book value multiples.
The stock chart shows that the share price has generally trended upward over the last several years, but with periods of pullback rather than a straight line. That pattern fits a mature industrial compounder more than a high-growth name. The company’s dividend yield sits a little above the sector median, which adds some income support, though the main financial attraction remains durable margins and steady cash generation.
Growth
Illinois Tool Works operates in industrial niches that are mature overall, but not stagnant. Demand is tied to vehicle production, commercial food equipment replacement, factory automation, construction activity, welding, and maintenance spending. These are not explosive markets, yet they are deeply embedded in the real economy and tend to generate recurring demand over time. That makes the company more of a steady industrial operator than a business dependent on one breakthrough trend.
Its strategy for future growth is centered on the company’s long-standing “80/20” operating approach, product simplification, customer-focused innovation, and disciplined capital allocation. In plain terms, management tries to concentrate effort on the most valuable products and customers, eliminate unnecessary complexity, and preserve pricing power. For a company like ITW, that strategy can be more effective than chasing volume at low margins.
Recent revenue growth has improved after a softer period in 2024 and early 2025. The rebound into 2026 suggests end-market demand has stabilized and that the company is moving past a temporary slowdown rather than entering a deep structural decline. Even so, revenue growth remains moderate compared with many industrial peers, which reinforces the idea that ITW is primarily a margin-and-cash business rather than a rapid expansion case.
Free cash flow remains one of the most important positive signals. It rose strongly over the last several years and, although it has eased from its peak, it still remains at a high level in absolute terms. That matters because cash supports dividends, share repurchases, debt service, and selective acquisitions. A business that keeps producing billions of dollars in annual free cash flow has more flexibility than one that depends heavily on external financing.
A meaningful catalyst is the company’s exposure to replacement-driven and process-driven spending. Restaurants still need kitchen equipment, factories still need welding and testing tools, and manufacturers still need adhesives, fasteners, and fluids. In addition, trends such as automation, productivity improvement, supply-chain localization, and vehicle platform changes can create targeted opportunities across several segments. These are not single-event catalysts, but they can sustain incremental growth and pricing opportunities over time.
Recent company communications have also emphasized continuing capital returns, portfolio discipline, and operational execution. For a mature industrial group, that is significant because it suggests management is not relying on aggressive expansion assumptions to support performance. Instead, the model is built around extracting more earnings and cash from a broad installed base and specialized market positions.
Risks
This article is for informational purposes only and does not constitute financial advice. Some content is AI-generated. See Disclaimer