Stock Analysis · ITG Inc (ITG)
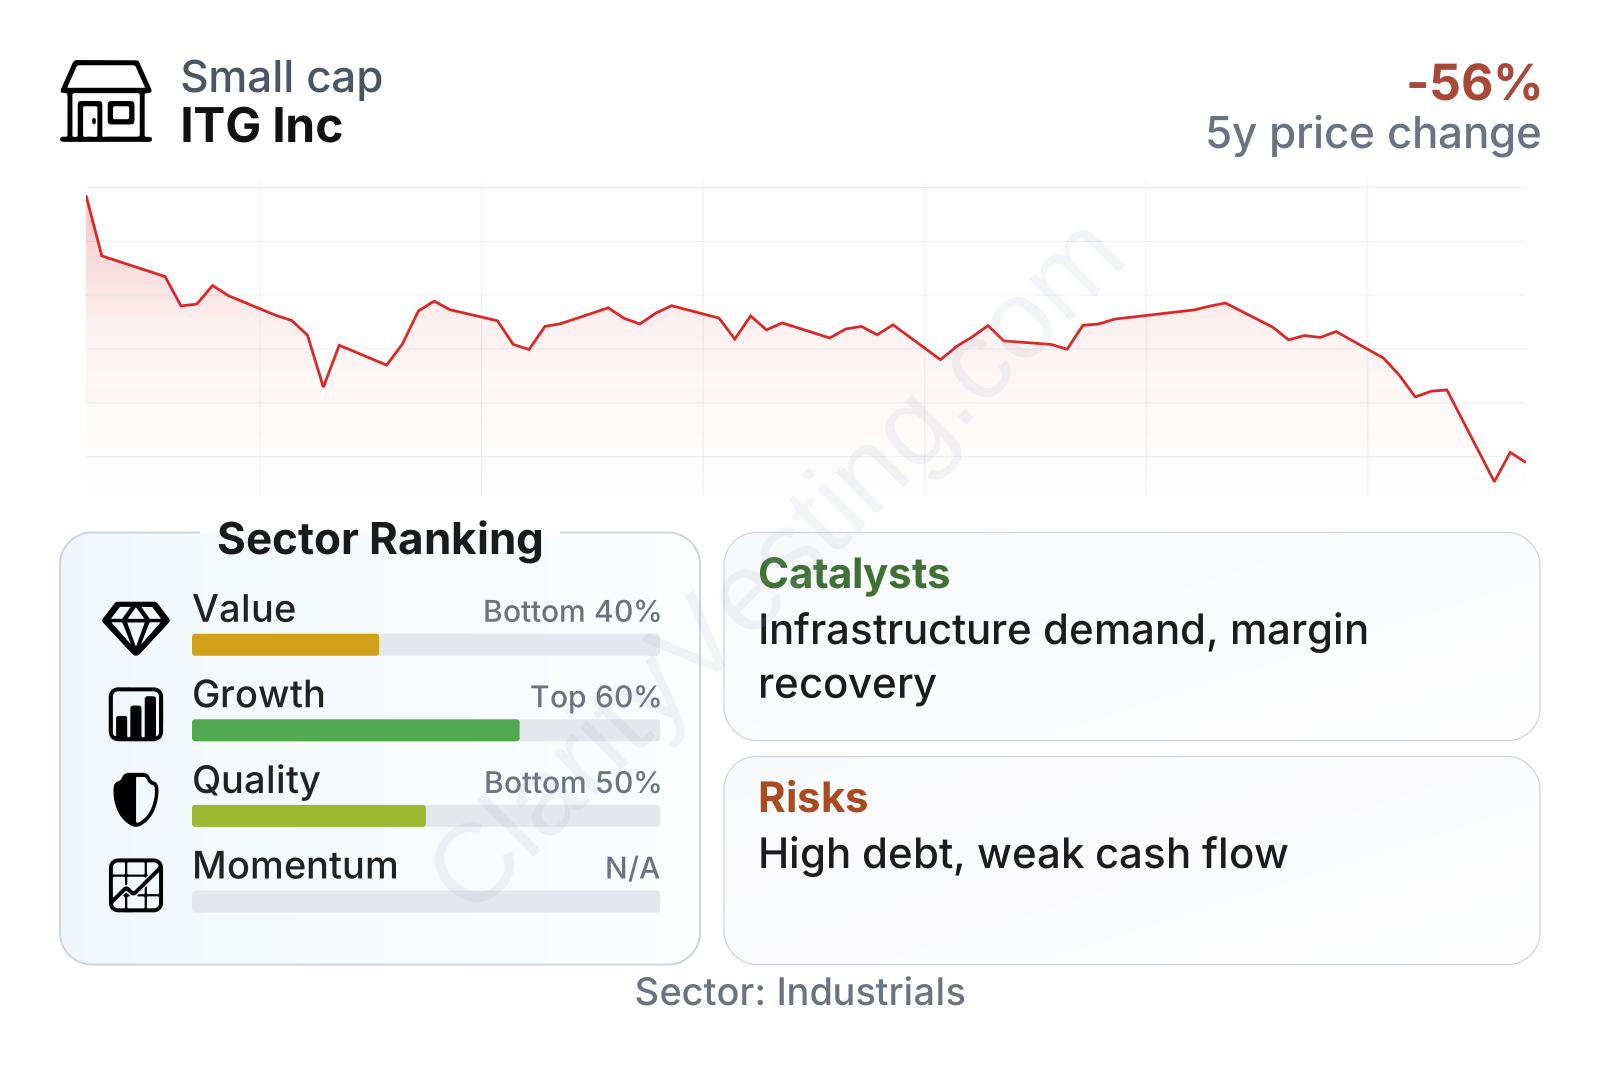
Overview
ITG Inc is a small industrial company in engineering and construction. Its business is tied to designing, building, and supporting infrastructure and industrial projects. In practical terms, that usually means earning revenue from project work, installation and construction activity, and related services delivered to customers over the life of a contract.
The company’s revenue mix is not disclosed in the material provided with a precise segment breakdown for 2026, so a ranked percentage split by business line cannot be stated reliably here. What is clear from recent annual results is that ITG is primarily driven by core project revenue rather than by financial or non-operating income, and that the business remains heavily cost-intensive, which is typical in construction-related activities.
The latest full-year numbers show revenue a little above $1.1 billion in 2025, up from roughly $1.0 billion in 2024. However, most of that revenue is absorbed by direct project costs and operating expenses. Gross profit improved slightly year over year, but higher overhead and interest expense weighed on final earnings, turning a modest profit in 2024 into roughly break-even to slightly negative net income in 2025.
This matters for long-term readers because engineering and construction companies are often judged less by headline revenue alone and more by execution quality: project pricing, cost control, working capital discipline, and balance sheet strength. ITG’s recent profile suggests a business that can still win work and grow sales, but that has less room for error than stronger peers.
The operating picture shows a familiar pattern for contractors: large revenue flowing through a relatively thin profit layer. Revenue rose in 2025, but interest costs also moved higher and overhead expanded materially, which left very little at the bottom line. That makes margin recovery and cash generation more important than sales growth alone.
Key Figures
| Metric | Value | Sector ⓘ |
|---|---|---|
| Date | Oct 17, 2026 | |
| Context | ||
| Sector | Industrials | |
| Industry | Engineering & Construction | |
| Market Cap ⓘ | $962.64M | |
| Beta ⓘ | N/A | |
Value (Cheapness) | ||
| P/E Ratio ⓘ | N/A | 22.10 |
| P/B Ratio ⓘ | 36.19 | 1.97 |
| FCF Yield ⓘ | -8.32% | 6.38% |
| Dividend Yield ⓘ | N/A | 1.94% |
| EBIT / EV ⓘ | 5.04% | 4.79% |
| PEG ⓘ | N/A | |
Growth (Business expansion) | ||
| Revenue Growth ⓘ | 38.40% | 9.30% |
| RPS Growth (5Y CAGR) ⓘ | 6.61% | 7.81% |
| EPS Growth (5Y CAGR) ⓘ | N/A | -13.06% |
| BVPS Growth (5Y CAGR) ⓘ | -24.68% | 6.14% |
| Margin Growth (5Y Trend) ⓘ | 12.33% | 0.88% |
| FCF Growth (5Y CAGR) ⓘ | N/A | 11.01% |
| DPS Growth (5Y CAGR) ⓘ | N/A | 9.48% |
Quality (Business durability) | ||
| ROIC (Latest) ⓘ | N/A | 10.84% |
| ROA (Latest) ⓘ | N/A | 5.41% |
| ROIC (5Y Median) ⓘ | N/A | 9.38% |
| ROA (5Y Median) ⓘ | -0.05% | 4.95% |
| Net Debt / EBIT (Latest) ⓘ | 12.65 | 2.08 |
| Net Debt / EBIT (5Y Median) ⓘ | -5.34 | 2.27 |
| Net Debt / EBITDA (Latest) ⓘ | 5.97 | 1.39 |
| Net Debt / Assets ⓘ | 81.68% | 19.28% |
| EBITDA / Interest ⓘ | 3.48 | 9.58 |
| Operating Margin (Latest) ⓘ | 5.49% | 10.50% |
| Operating Margin (5Y Median) ⓘ | 2.36% | 10.29% |
| Debt to Equity (Latest) ⓘ | 2546.19% | 65.48% |
| Profit Margin (Latest) ⓘ | -1.33% | 6.67% |
| Free Cash Flow (Latest) ⓘ | -$80.06M | |
Momentum (Price trend) | ||
| 3Y Return ⓘ | N/A | +61.68% |
| 12M Return (excl. last month) ⓘ | N/A | +12.58% |
| 6M Return ⓘ | N/A | 0.00% |
| Price vs. 200-Day MA ⓘ | N/A | +0.02% |
The market is treating ITG as a smaller industrial company with a mixed fundamental profile. Growth metrics look better than many sector peers, helped by strong recent revenue expansion and a clear improvement in operating margin versus the company’s own five-year history. But quality measures are weaker: leverage is high, profitability is thin, free cash flow is negative, and interest coverage is well below the sector median. Valuation signals are also uneven, with a very high price-to-book ratio and no support from current cash flow generation.
The sharp drop in the share price between early July and late September 2026 suggests that the market has recently reassessed the company’s outlook or financial risk. For long-term analysis, that decline is less important by itself than what caused it: when a company carries elevated debt and weak cash conversion, sentiment can shift quickly if investors begin to doubt margin stability or refinancing flexibility.
Growth
ITG operates in a sector with long-term demand drivers. Engineering and construction activity benefits from infrastructure renewal, industrial facility upgrades, utility investment, and public-sector spending programs. Those themes can support multi-year project pipelines, especially for firms that have the technical ability to execute specialized work rather than only compete on price.
On the surface, the company’s recent growth is encouraging. Revenue increased about 38% year over year, far above the sector median in the available comparison. Operating margin has also improved meaningfully versus ITG’s own five-year trend, which can indicate better bidding discipline, more favorable project mix, or improving utilization.
That said, durable growth in this industry depends on more than winning contracts. A sensible strategy for future expansion would require ITG to convert rising sales into stronger operating profit and positive free cash flow while keeping debt under control. Without that, growth can become expensive rather than value-creating.
A potential catalyst is the broad need for infrastructure and industrial construction capacity. If the company has exposure to public works, utilities, energy-related projects, or specialized engineered services, that backdrop can create opportunities for backlog growth and improved scale. Another possible catalyst is internal: if management can stabilize overhead, reduce interest burden, and improve project execution, even modest margin gains could have an outsized effect on earnings because current profitability is thin.
The recent operating trend therefore looks like a transition period rather than a fully established growth phase. ITG appears to have demand, but the next step is proving that higher revenue can consistently produce stronger returns.
Risks
This article is for informational purposes only and does not constitute financial advice. Some content is AI-generated. See Disclaimer


