Stock Analysis · iShares MSCI (ISRMF)
Overview
iShares MSCI, trading under the symbol ISRMF, is not an operating company in the usual sense. It is an exchange-traded fund, or ETF. An ETF is a basket of securities that trades on the stock market like a share. This fund is designed to track an MSCI index, which means its goal is to follow the performance of a defined group of stocks rather than to run factories, drill wells, or sell products directly.
That point matters for long-term analysis because the economics of an ETF are very different from those of a traditional business. The fund’s value depends mainly on the market value of the securities it holds, the quality of the index methodology, and the costs charged to investors. Unlike a normal company, it does not have operating revenue from customers in the classic sense, and it does not usually report sales by product line the way a manufacturer or energy producer would.
The main economic inputs for a fund like this generally come from:
- Management fees: the annual fee charged to run the fund and track the index.
- Securities lending and other fund-level income: in some cases, funds can earn additional income by lending securities they own, subject to their policies.
- Investment performance of holdings: this is not revenue to the fund manager in the same way as company sales, but it is the main driver of the fund’s net asset value and long-term returns for shareholders.
Because ISRMF is a fund vehicle rather than a conventional business, standard company revenue breakdowns, operating segments, and product margins are not the right framework here. The most important practical questions are what index it tracks, what it owns, how diversified it is, what it costs, and how consistently it follows its benchmark.
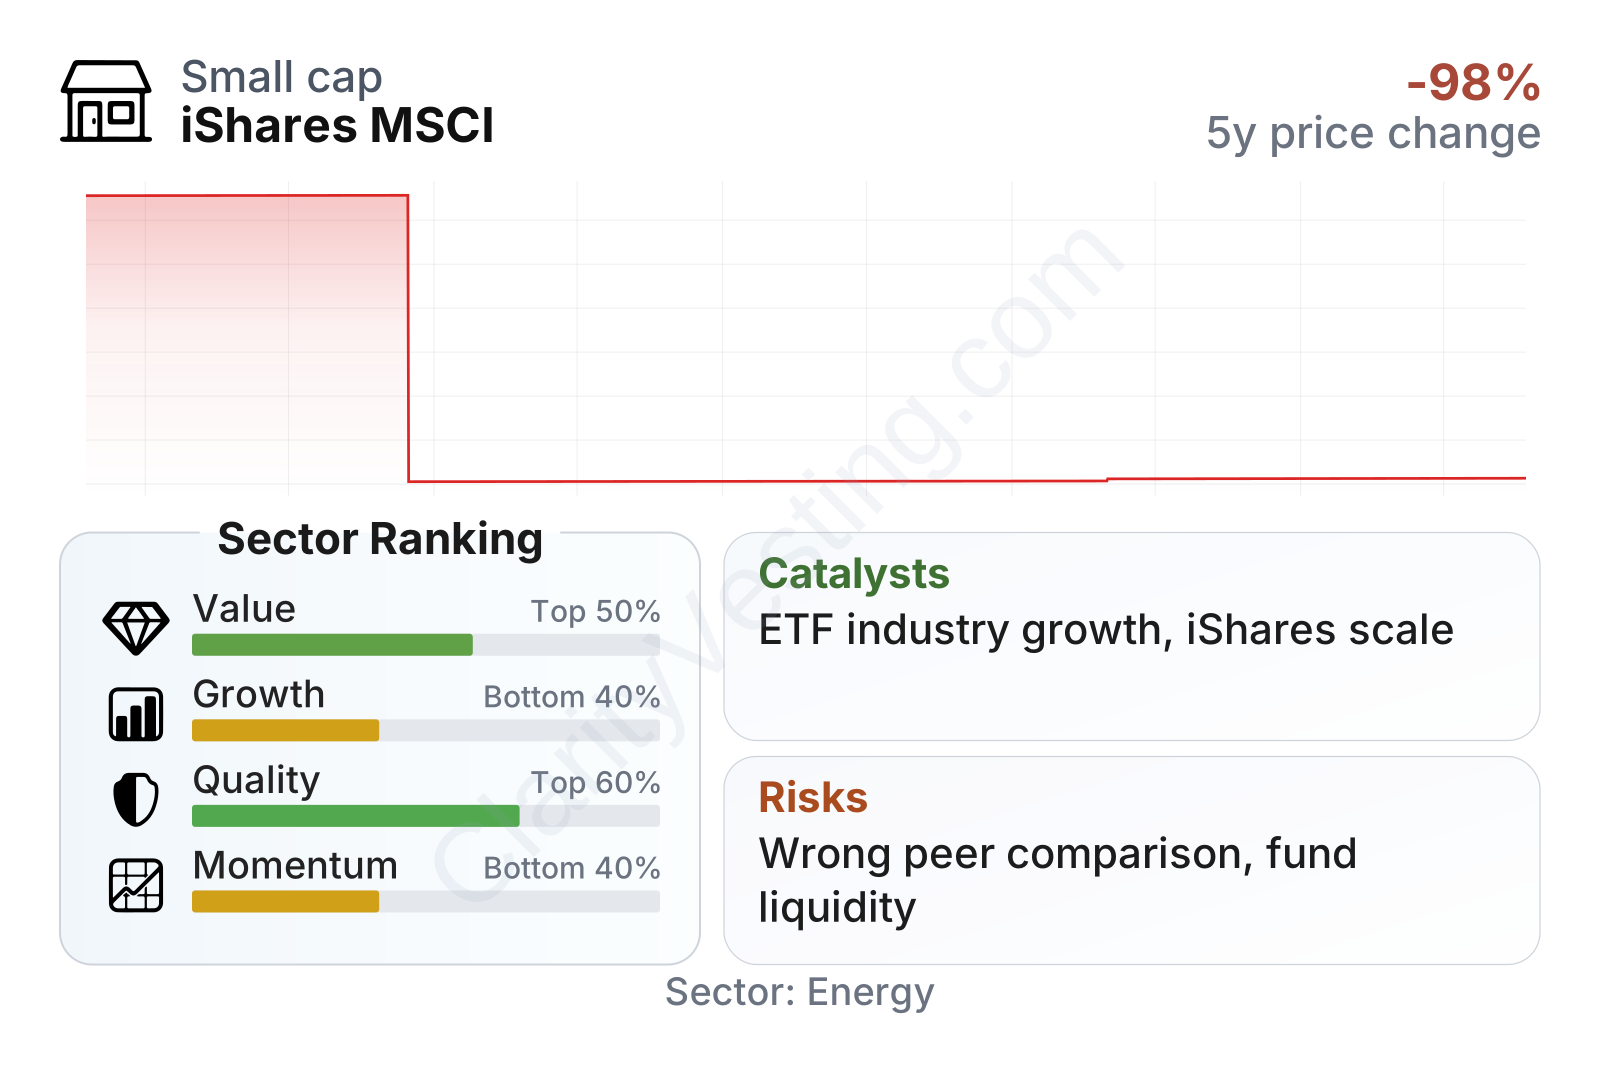
A note on classification: the market data attached to the symbol appears to classify ISRMF as if it were an energy exploration and production company. That does not match the fund structure implied by the name “iShares MSCI.” For a long-term article intended to be reliable, the fund should be analyzed as an ETF, not as an oil and gas operating business. As a result, the operating metrics shown later should be read with caution because they are not economically meaningful for an index fund.
The financial flow view is not especially useful in this case because it resembles the profile of an operating business, while ISRMF is a listed fund. For this security, portfolio composition, tracking quality, cost, assets under management, and index exposure are more informative than business-style income flows.
Key Figures
| Metric | Value | Sector ⓘ |
|---|---|---|
| Date | Oct 17, 2026 | |
| Context | ||
| Sector | Energy | |
| Industry | Oil & Gas E&P | |
| Market Cap ⓘ | $1.72B | |
| Beta ⓘ | 0.10 | |
Value (Cheapness) | ||
| P/E Ratio ⓘ | 13.20 | 15.44 |
| P/B Ratio ⓘ | 2.89 | 1.73 |
| FCF Yield ⓘ | 5.93% | 8.20% |
| Dividend Yield ⓘ | 4.09% | 3.59% |
| EBIT / EV ⓘ | 8.95% | 7.46% |
| PEG ⓘ | N/A | |
Growth (Business expansion) | ||
| Revenue Growth ⓘ | 10.90% | 26.90% |
| RPS Growth (5Y CAGR) ⓘ | 7.52% | 6.90% |
| EPS Growth (5Y CAGR) ⓘ | -25.47% | -15.73% |
| BVPS Growth (5Y CAGR) ⓘ | 12.20% | 6.07% |
| Margin Growth (5Y Trend) ⓘ | -8.57% | 0.58% |
| FCF Growth (5Y CAGR) ⓘ | 41.62% | 1.86% |
| DPS Growth (5Y CAGR) ⓘ | 1.20% | 16.79% |
Quality (Business durability) | ||
| ROIC (Latest) ⓘ | 13.79% | 11.40% |
| ROA (Latest) ⓘ | 8.93% | 6.06% |
| ROIC (5Y Median) ⓘ | N/A | 10.30% |
| ROA (5Y Median) ⓘ | 10.54% | 5.42% |
| Net Debt / EBIT (Latest) ⓘ | 2.07 | 1.64 |
| Net Debt / EBIT (5Y Median) ⓘ | 1.83 | 1.83 |
| Net Debt / EBITDA (Latest) ⓘ | 1.59 | 1.08 |
| Net Debt / Assets ⓘ | 28.88% | 17.29% |
| EBITDA / Interest ⓘ | 5.56 | 9.64 |
| Operating Margin (Latest) ⓘ | 44.31% | 16.27% |
| Operating Margin (5Y Median) ⓘ | 49.52% | 20.39% |
| Debt to Equity (Latest) ⓘ | 73.01% | 54.76% |
| Profit Margin (Latest) ⓘ | 28.15% | 8.82% |
| Free Cash Flow (Latest) ⓘ | $101.86M | |
Momentum (Price trend) | ||
| 3Y Return ⓘ | +119.71% | +67.38% |
| 12M Return (excl. last month) ⓘ | +8.02% | +49.19% |
| 6M Return ⓘ | +4.25% | +7.07% |
| Price vs. 200-Day MA ⓘ | +2.14% | +9.56% |
The summary metrics paint a mixed picture, but they should be interpreted carefully. Some valuation and profitability readings appear stronger than the sector median, while growth and momentum rank lower. That kind of comparison would normally help with stock analysis, yet it is less reliable here because the security is being compared with oil and gas producers instead of similar ETFs. The very low beta suggests limited measured volatility versus the broader market, but for a fund the more relevant questions are benchmark exposure, diversification, and fee drag over time.
Growth
The long-term growth case for an MSCI-based iShares fund usually comes from broad structural trends rather than internal corporate expansion. The strongest industry tailwinds for ETFs are the continuing shift from higher-cost active management toward lower-cost index products, growing use of ETFs by both retail and institutional investors, and the convenience of trading diversified exposure through a single listed instrument.
If ISRMF tracks a well-defined MSCI index in an area with durable long-term demand, that can support steady asset growth over time. In fund analysis, growth is less about selling more products and more about attracting assets, keeping costs competitive, and maintaining tight tracking to the benchmark. BlackRock’s iShares platform is one of the largest ETF franchises in the world, which can help through distribution reach, brand familiarity, and operating scale.
The revenue growth pattern shown here is volatile, including periods of strong expansion followed by sharp declines. That kind of uneven movement is common in commodity-linked operating businesses, but again it is not the right lens for an ETF. For long-term fund analysis, the more important growth signal would be whether the tracked market segment is gaining investor attention and whether the fund is gathering assets consistently.
The free cash flow trend shown is positive overall, but this also fits poorly with a fund structure. A more useful forward-looking catalyst would be any increase in demand for the fund’s underlying index exposure, especially if the index addresses a market theme with durable relevance. Another useful catalyst would be lower fees, stronger liquidity, or a growing asset base, all of which can improve the fund’s usefulness and resilience over time.
Without a confirmed current 2026 fund report in this prompt, the most balanced view is that the ETF industry remains a growing part of global investing, and the iShares brand is well positioned to benefit from that. The strength of ISRMF specifically depends on the quality and attractiveness of the exact MSCI exposure it offers.
Risks
This article is for informational purposes only and does not constitute financial advice. Some content is AI-generated. See Disclaimer


