Stock Analysis · International Petroleum Corporation (IPCFF)
Overview
International Petroleum Corporation is an oil and gas exploration and production company. In simple terms, it buys, develops, and operates fields that produce crude oil and natural gas, then sells those commodities into local and international markets. The company was created as a spin-off from Lundin Petroleum and today operates a portfolio spread across Canada, Malaysia, and France, with additional interests in other international assets depending on the period and project mix. Its business is centered on producing hydrocarbons efficiently, extending the life of its reserves, and using cash flow from mature assets to fund development projects and shareholder distributions when conditions allow.
Revenue mainly comes from selling produced oil and gas. Based on the company’s recent annual disclosures, the mix is still dominated by oil-linked production, with natural gas and natural gas liquids contributing a smaller but still meaningful share. The exact split can move with commodity prices as much as with production volumes, but the broad structure is as follows:
- Crude oil: approximately 70% to 80% of revenue. This is the company’s largest source of income and includes production from its main operated fields, especially in Canada and Malaysia.
- Natural gas: approximately 10% to 20% of revenue. This includes gas sold from producing assets, with exposure varying by region and local pricing conditions.
- Natural gas liquids and other petroleum products: approximately 5% to 10% of revenue. These are by-products associated with hydrocarbon production and can add useful cash flow depending on regional market prices.
Geographically, Canada is the core of the business and has typically represented the largest share of both production and reserves, while Malaysia provides important diversification through offshore production. France is smaller in scale but still contributes established output. This combination gives the company a mix of long-life conventional production and development upside rather than a pure high-growth shale model.
Over the last several years, the income flow has become notably tighter. Revenue rose sharply during the strong 2022 commodity cycle, then softened afterward as oil prices, margins, and earnings normalized. Costs and interest expense have taken a larger share of sales more recently, which helps explain why revenue has stayed meaningful while profit has compressed.
Key Figures
| Metric | Value | Sector ⓘ |
|---|---|---|
| Date | Oct 03, 2026 | |
| Context | ||
| Sector | Energy | |
| Industry | Oil & Gas E&P | |
| Market Cap ⓘ | $2.65B | |
| Beta ⓘ | 0.91 | |
Value (Cheapness) | ||
| P/E Ratio ⓘ | 125.05 | 14.47 |
| P/B Ratio ⓘ | 3.01 | 1.70 |
| FCF Yield ⓘ | -3.89% | 8.66% |
| Dividend Yield ⓘ | N/A | 3.77% |
| EBIT / EV ⓘ | 2.84% | 7.46% |
| PEG ⓘ | N/A | |
Growth (Business expansion) | ||
| Revenue Growth ⓘ | 17.00% | 27.35% |
| RPS Growth (5Y CAGR) ⓘ | 10.14% | 6.75% |
| EPS Growth (5Y CAGR) ⓘ | -50.06% | -15.45% |
| BVPS Growth (5Y CAGR) ⓘ | 11.49% | 5.85% |
| Margin Growth (5Y Trend) ⓘ | -13.28% | 0.75% |
| FCF Growth (5Y CAGR) ⓘ | N/A | 3.62% |
| DPS Growth (5Y CAGR) ⓘ | N/A | 16.85% |
Quality (Business durability) | ||
| ROIC (Latest) ⓘ | N/A | 11.33% |
| ROA (Latest) ⓘ | 1.07% | 6.03% |
| ROIC (5Y Median) ⓘ | 13.76% | 10.16% |
| ROA (5Y Median) ⓘ | 9.24% | 5.34% |
| Net Debt / EBIT (Latest) ⓘ | 5.44 | 1.62 |
| Net Debt / EBIT (5Y Median) ⓘ | 0.51 | 1.91 |
| Net Debt / EBITDA (Latest) ⓘ | 2.23 | 1.06 |
| Net Debt / Assets ⓘ | 25.16% | 17.29% |
| EBITDA / Interest ⓘ | 5.00 | 9.64 |
| Operating Margin (Latest) ⓘ | 12.29% | 16.32% |
| Operating Margin (5Y Median) ⓘ | 24.71% | 19.53% |
| Debt to Equity (Latest) ⓘ | 56.91% | 54.41% |
| Profit Margin (Latest) ⓘ | 3.07% | 8.79% |
| Free Cash Flow (Latest) ⓘ | -$103.22M | |
Momentum (Price trend) | ||
| 3Y Return ⓘ | +150.16% | +62.93% |
| 12M Return (excl. last month) ⓘ | +33.52% | +44.83% |
| 6M Return ⓘ | -12.15% | -1.62% |
| Price vs. 200-Day MA ⓘ | +1.70% | +5.18% |
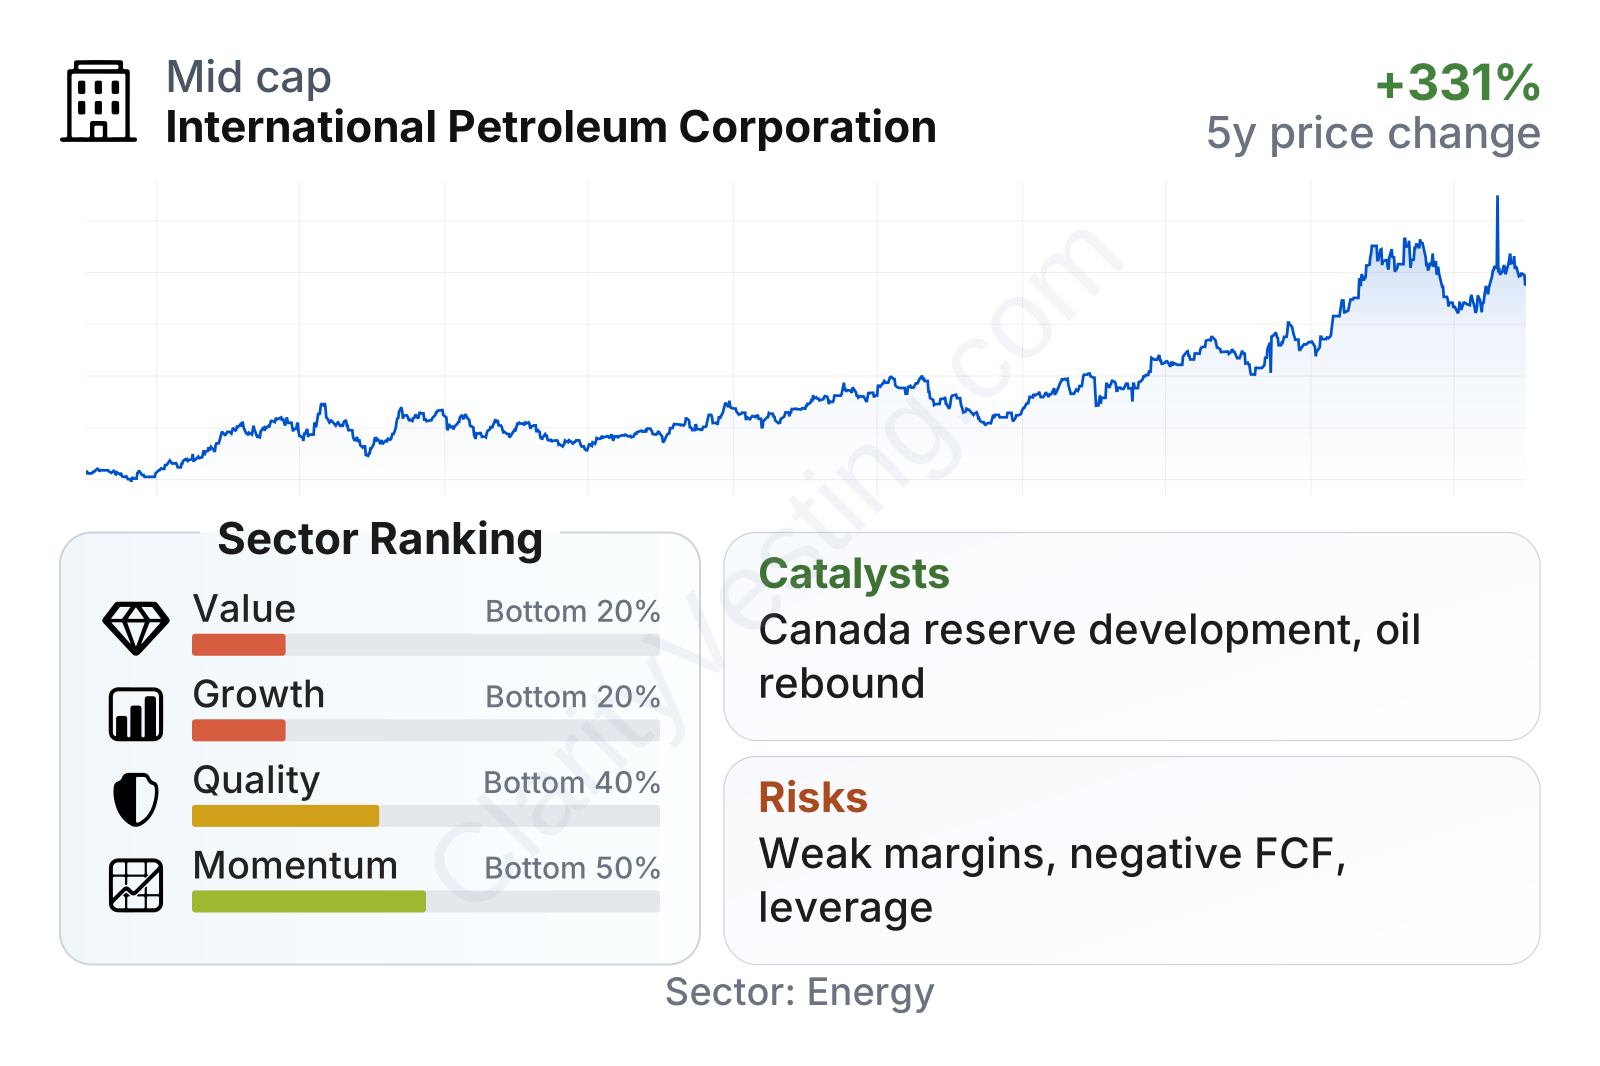
The market value places International Petroleum in the mid-sized range within the upstream energy space. Share price performance over three years has been strong, but shorter-term trading has been more uneven, reflecting the normal volatility of oil and gas equities. The factor summary is currently weaker than the broader sector in several areas: valuation looks expensive on trailing earnings and cash flow measures, growth metrics have cooled, and recent quality indicators are under pressure from lower profitability and higher leverage versus the company’s own earlier cycle.
One important nuance is that the company’s long-term record looks better than its latest twelve-month snapshot. Five-year measures for return on capital, book value growth, and revenue per share are stronger than many peers, even though the most recent earnings period looks much less favorable. That gap suggests the current picture is being shaped heavily by the down part of the commodity cycle and by elevated investment spending.
Growth
International Petroleum operates in a sector that is mature rather than structurally high-growth. Global oil demand is still large, and many producing regions need ongoing investment just to offset natural decline, which creates room for disciplined operators. However, long-term growth in this industry is rarely smooth. It depends on reserve replacement, development execution, and commodity prices more than on steady consumer demand trends.
For International Petroleum, the main strategic case for future expansion rests on getting more value out of its existing asset base. The company has emphasized reserve life, operational efficiency, and phased development rather than pursuing aggressive, high-cost expansion. That approach can make sense in upstream energy because it lowers the risk of overbuilding at the wrong point in the cycle. Its Canadian thermal assets, together with producing assets in Malaysia, give it a platform where incremental project execution can support production over time if capital spending remains disciplined.
Revenue growth has been volatile. After the post-2021 surge, the business went through several periods of contraction before returning to growth more recently. The latest year-over-year improvement is encouraging, but the broader pattern shows a cyclical company rather than one delivering steady linear expansion. This matters for long-term analysis because growth here should be judged across a full commodity cycle, not quarter by quarter.
Free cash flow is the more important near-term watch item. The company generated strong cash in earlier periods, but trailing figures have turned negative for an extended stretch. That does not automatically mean deterioration in the business model; in oil and gas it can reflect heavy development spending. Still, for growth to be seen as durable, those investments eventually need to translate into higher production, stronger margins, or both.
A meaningful catalyst is the company’s ability to develop its large reserve base in Canada while maintaining production from international assets. Another positive factor is its operational diversity versus smaller single-basin producers. Recent company updates have also highlighted ongoing field development and production management efforts that could improve output stability if execution remains solid. In a stronger oil price environment, this portfolio can produce a sharp rebound in earnings and cash generation because much of the infrastructure is already in place.
Risks
This article is for informational purposes only and does not constitute financial advice. Some content is AI-generated. See Disclaimer


