Stock Analysis · Ionis Pharmaceuticals Inc (IONS)
Overview
Ionis Pharmaceuticals is a biotechnology company focused on discovering and developing RNA-targeted medicines. In simple terms, it designs drugs that aim to switch off or reduce the production of harmful proteins linked to disease. This approach has been applied in rare neurological diseases, cardiovascular conditions, and other serious disorders where conventional drug methods can be less precise.
Ionis makes money from a mix of commercial medicines and partnership-related payments. Its business model is different from a traditional large pharmaceutical company because a meaningful share of revenue can come from licensing, milestone payments, and collaborations with larger drugmakers that help fund development and commercialization.
Based on recent company disclosures, the main revenue sources can be described as follows:
- Commercial revenue from Ionis-led products and product sales: roughly the largest single operating source in 2025, supported by medicines such as TRYNGOLZA and commercialization-related activity. This includes direct product sales where Ionis participates commercially.
- Licensing and collaboration revenue: a major source that can represent a very large share in some periods, coming from upfront fees, milestone payments, and research support from partners such as AstraZeneca, Biogen, Novartis, and others.
- Royalty revenue: a smaller but strategically important stream, generated from partnered products already on the market, including medicines where Ionis receives a percentage of partner sales.
Because milestone payments can move significantly from one period to another, exact percentages can swing sharply. For full-year 2025, a practical way to think about the mix is that collaboration and licensing revenue plus commercial product revenue made up most of the total, while royalties remained the smallest of the three main categories. This also explains why reported revenue can look uneven from quarter to quarter even when the pipeline itself is advancing.
Financially, the company still spends heavily on research and development. Over the last several years, revenue has remained substantial, but research spending and commercialization costs have consistently exceeded gross profit, which has kept operating results in the red. That pattern is common in biotechnology, but it matters because Ionis is trying to move from a partner-funded research platform toward a broader commercial business with more direct product exposure.
The broad financial pattern is clear: revenue has been meaningful and recently improved on a full-year basis, but research and development remains the dominant cash use, with selling expenses also rising as Ionis builds its commercial presence.
Key Figures
| Metric | Value | Sector ⓘ |
|---|---|---|
| Date | Oct 10, 2026 | |
| Context | ||
| Sector | Healthcare | |
| Industry | Biotechnology | |
| Market Cap ⓘ | $7.34B | |
| Beta ⓘ | 0.38 | |
Value (Cheapness) | ||
| P/E Ratio ⓘ | N/A | 24.79 |
| P/B Ratio ⓘ | 16.29 | 2.97 |
| FCF Yield ⓘ | -7.62% | 3.11% |
| Dividend Yield ⓘ | N/A | 2.04% |
| EBIT / EV ⓘ | -7.32% | 0.57% |
| PEG ⓘ | 25.70 | |
Growth (Business expansion) | ||
| Revenue Growth ⓘ | -40.70% | 7.35% |
| RPS Growth (5Y CAGR) ⓘ | 0.66% | 8.61% |
| EPS Growth (5Y CAGR) ⓘ | -20.38% | -18.43% |
| BVPS Growth (5Y CAGR) ⓘ | -13.56% | 3.94% |
| Margin Growth (5Y Trend) ⓘ | N/A | -0.61% |
| FCF Growth (5Y CAGR) ⓘ | N/A | 0.88% |
| DPS Growth (5Y CAGR) ⓘ | N/A | 6.74% |
Quality (Business durability) | ||
| ROIC (Latest) ⓘ | -19.10% | 3.34% |
| ROA (Latest) ⓘ | -18.74% | 2.95% |
| ROIC (5Y Median) ⓘ | -11.58% | 4.60% |
| ROA (5Y Median) ⓘ | -11.67% | 1.89% |
| Net Debt / EBIT (Latest) ⓘ | N/A | 1.36 |
| Net Debt / EBIT (5Y Median) ⓘ | N/A | 1.86 |
| Net Debt / EBITDA (Latest) ⓘ | 0.48 | 1.02 |
| Net Debt / Assets ⓘ | 69.07% | 5.85% |
| EBITDA / Interest ⓘ | 48.40 | 9.60 |
| Operating Margin (Latest) ⓘ | -57.44% | 9.19% |
| Operating Margin (5Y Median) ⓘ | -32.80% | 7.53% |
| Debt to Equity (Latest) ⓘ | 549.98% | 29.44% |
| Profit Margin (Latest) ⓘ | -64.66% | 3.52% |
| Free Cash Flow (Latest) ⓘ | -$558.88M | |
Momentum (Price trend) | ||
| 3Y Return ⓘ | -6.76% | +34.80% |
| 12M Return (excl. last month) ⓘ | -7.03% | +19.33% |
| 6M Return ⓘ | -42.25% | +7.18% |
| Price vs. 200-Day MA ⓘ | -37.88% | +3.20% |
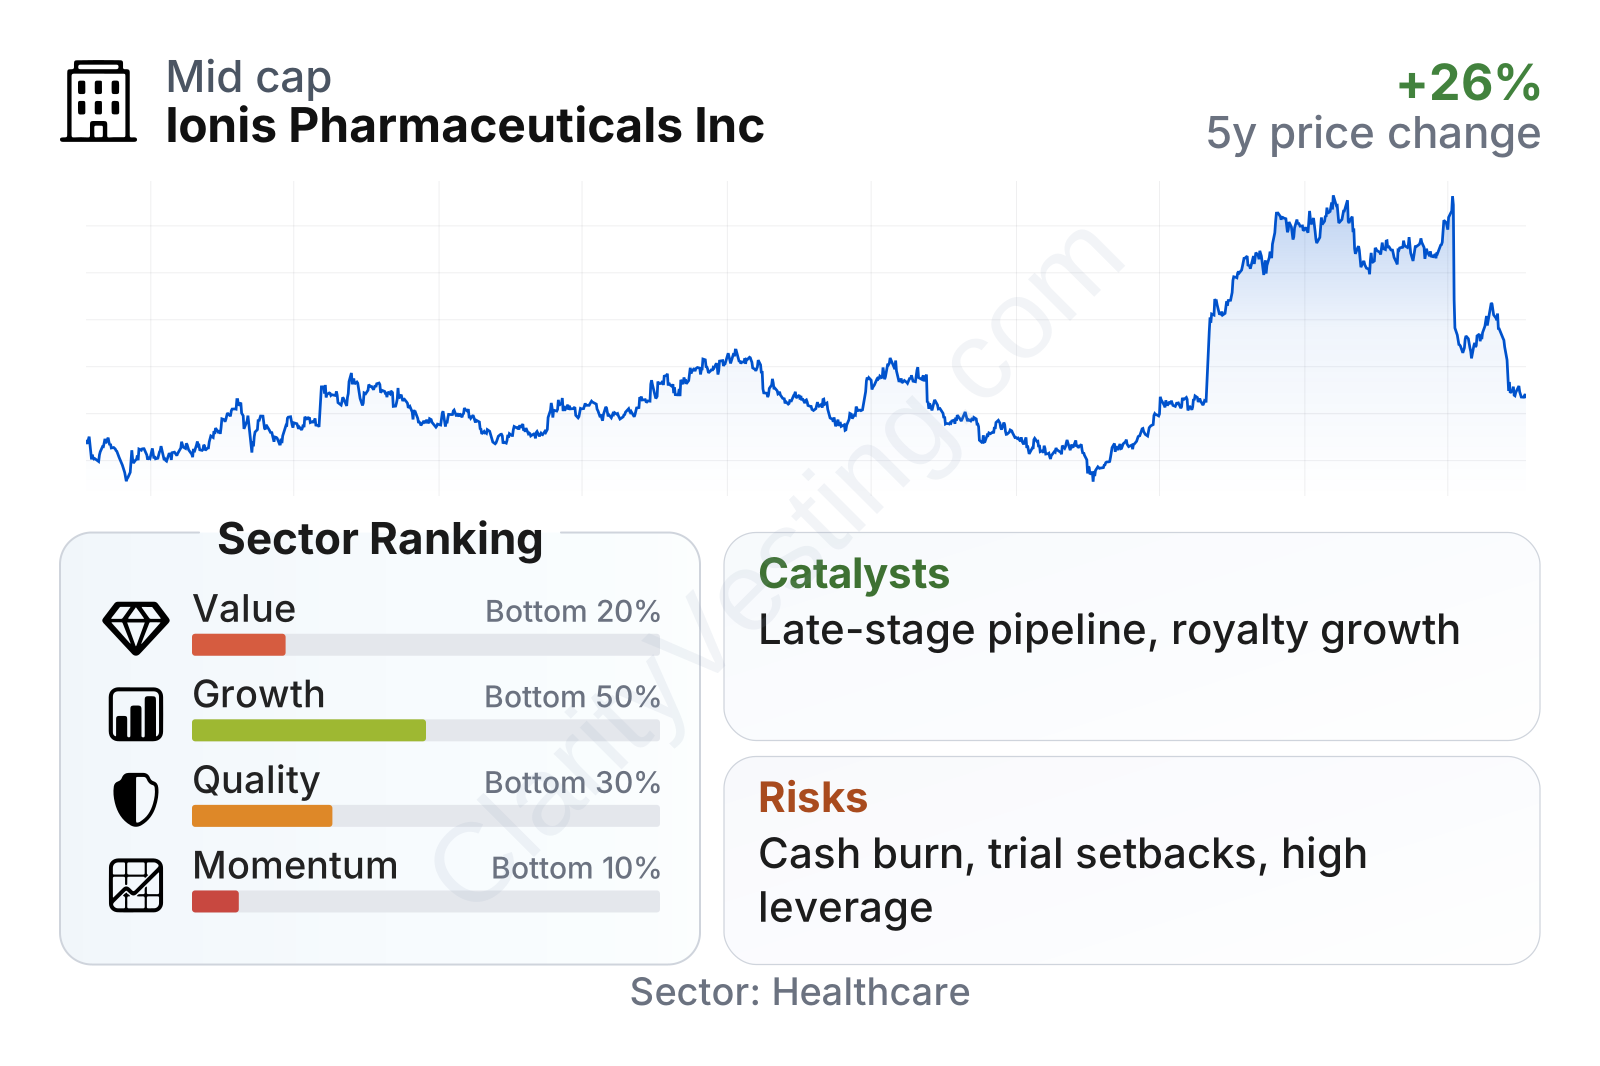
Ionis is a mid-sized biotechnology company with a market value in the multi-billion-dollar range. Its share price history shows large swings, which is typical for a company whose outlook depends heavily on clinical progress, regulatory decisions, and milestone timing. The stock also appears less sensitive than many peers to broad market moves, but company-specific events have still driven sharp changes.
The overall factor profile is weak relative to the healthcare sector. Value metrics look demanding, largely because the company is still unprofitable and free cash flow is negative. Quality measures also rank poorly, with deeply negative returns on capital and assets and margins well below sector norms. Growth metrics are mixed at best: headline revenue can jump when milestones arrive, but the longer-term per-share trend has been modest. Momentum has been especially volatile, with a strong rebound over part of the last year followed by a significant retreat in recent months.
Growth
Ionis operates in a part of healthcare that still has long runway potential. RNA-based medicines have become more established over the last decade, and regulators as well as large pharmaceutical partners are more comfortable with the science than they were in earlier years. That matters because Ionis has one of the deepest histories in antisense technology, giving it a credible place in a growing field rather than a speculative position built on a single program.
The company’s strategy for future expansion is coherent. It combines three engines: internal drug development, partner-funded pipeline programs, and selective direct commercialization. In theory, this reduces dependence on any one medicine. In practice, it also gives Ionis several ways to create value: launching its own products, collecting royalties from partner-led launches, and receiving milestones when pipeline programs advance.
A major catalyst is the company’s late-stage pipeline and the continued buildout of its commercial portfolio. Ionis has been highlighting progress in cardiometabolic disease, neurology, and rare disease programs. For long-term analysis, the most important point is not any single quarter’s sales number but whether more programs move from development into approved products and recurring royalty streams.
Revenue growth has been highly uneven rather than steadily compounding. Some quarters show very strong expansion and others sharp declines, which reflects the lumpy nature of collaboration payments and milestones. That volatility does not automatically mean weakening demand, but it does make the business harder to model than a typical pharmaceutical company with a broad base of recurring product sales.
Cash generation remains the main financial weak spot. Free cash flow has stayed negative and worsened materially through the most recent trailing periods, showing that the company is still funding a large development engine ahead of the earnings power it hopes to achieve later. The growth case therefore depends on future launches, milestone receipts, and royalties arriving fast enough to absorb those ongoing investments.
Recent corporate updates have also reinforced the idea that Ionis is trying to become more commercially relevant, not just a discovery platform for partners. If additional late-stage assets succeed, the company could gradually shift toward a more durable revenue base with less dependence on one-time collaboration accounting.
Risks
This article is for informational purposes only and does not constitute financial advice. Some content is AI-generated. See Disclaimer