Stock Analysis · Ionic Digital Inc (IOND)
Overview
Ionic Digital Inc is a digital infrastructure company built around large-scale Bitcoin mining and related energy-intensive computing operations. In simple terms, it runs specialized data centers filled with high-performance machines that validate transactions on the Bitcoin network and earn Bitcoin as compensation. The company emerged from assets formerly connected to Celsius Network’s restructuring, which makes it a relatively new public equity with a business model tied closely to cryptocurrency economics, power availability, and data center execution.
Its revenue base is still concentrated and easier to understand than that of a diversified financial company. The main economic driver is the value of Bitcoin produced by its mining fleet, while other activity appears to be limited or still developing. Based on company disclosures and the structure of the business, revenue can be described as follows:
- Bitcoin mining revenue: approximately 100% of current operating revenue. This includes Bitcoin earned from mining activity, usually recognized based on the fair value of Bitcoin received when blocks are validated or mining pool rewards are earned.
- Other revenue: limited or not yet material. The company has discussed broader digital infrastructure ambitions, but available public information does not indicate a sizable second revenue stream at this stage.
This concentration makes the business straightforward to follow, but it also means operating results are heavily exposed to three external variables: Bitcoin price, network difficulty, and electricity costs. Recent revenue trends point to some recovery versus the prior year, yet profitability remains inconsistent. The broader flow of income also shows a business that has not yet converted top-line activity into stable earnings or cash generation.
The multi-year financial pattern shows a sharp swing from profitability in 2021 to large losses in 2022 and 2023, followed by a partial revenue rebound in 2025 but still negative operating and net income. That matters for long-term analysis: revenue exists, but the cost structure and non-operating items have so far prevented durable earnings.
Key Figures
| Metric | Value | Sector ⓘ |
|---|---|---|
| Date | Oct 24, 2026 | |
| Context | ||
| Sector | Financial Services | |
| Industry | Capital Markets | |
| Market Cap ⓘ | $3.00B | |
| Beta ⓘ | N/A | |
Value (Cheapness) | ||
| P/E Ratio ⓘ | N/A | 12.46 |
| P/B Ratio ⓘ | 4.69 | 1.25 |
| FCF Yield ⓘ | -3.57% | 9.82% |
| Dividend Yield ⓘ | N/A | 2.94% |
| EBIT / EV ⓘ | 0.71% | 8.11% |
| PEG ⓘ | N/A | |
Growth (Business expansion) | ||
| Revenue Growth ⓘ | 30.80% | 9.10% |
| RPS Growth (5Y CAGR) ⓘ | 5.03% | 12.31% |
| EPS Growth (5Y CAGR) ⓘ | N/A | -6.97% |
| BVPS Growth (5Y CAGR) ⓘ | N/A | 5.02% |
| Margin Growth (5Y Trend) ⓘ | N/A | -4.00% |
| FCF Growth (5Y CAGR) ⓘ | -2.90% | 4.71% |
| DPS Growth (5Y CAGR) ⓘ | N/A | 8.92% |
Quality (Business durability) | ||
| ROIC (Latest) ⓘ | N/A | 9.18% |
| ROE (Latest) ⓘ | N/A | 13.93% |
| ROA (Latest) ⓘ | N/A | 1.57% |
| ROIC (5Y Median) ⓘ | N/A | 7.80% |
| ROE (5Y Median) ⓘ | N/A | 12.15% |
| ROA (5Y Median) ⓘ | N/A | 1.28% |
| Net Debt / EBIT (Latest) ⓘ | -17.76 | 1.02 |
| Net Debt / EBIT (5Y Median) ⓘ | N/A | 0.72 |
| Net Debt / EBITDA (Latest) ⓘ | -6.18 | 0.88 |
| Operating Margin (Latest) ⓘ | 13.12% | 22.30% |
| Operating Margin (5Y Median) ⓘ | -96.08% | 24.50% |
| Debt to Equity (Latest) ⓘ | 0.03% | 59.34% |
| Profit Margin (Latest) ⓘ | -183.75% | 26.42% |
| Free Cash Flow (Latest) ⓘ | -$107.14M | |
Momentum (Price trend) | ||
| 3Y Return ⓘ | N/A | +95.73% |
| 12M Return (excl. last month) ⓘ | N/A | +17.30% |
| 6M Return ⓘ | N/A | +6.07% |
| Price vs. 200-Day MA ⓘ | N/A | +5.36% |
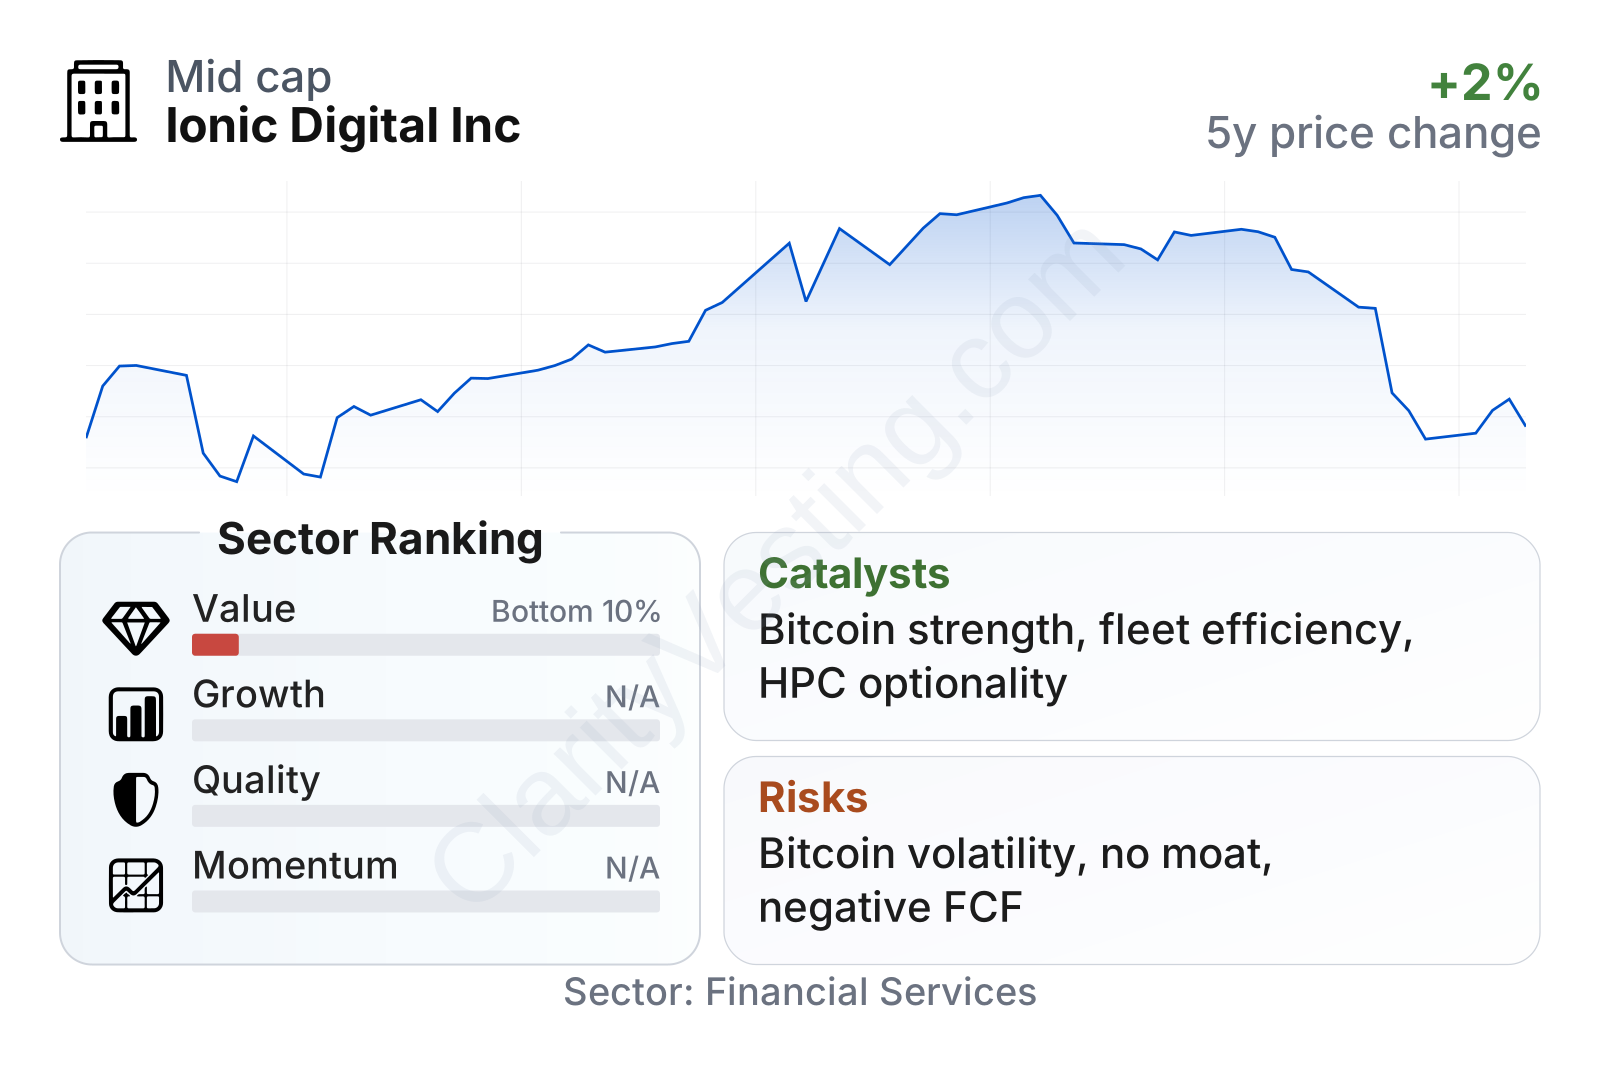
Ionic Digital is a mid-sized listed company by market value, but its financial profile is unusual compared with most companies in the broader financial sector classification. Revenue growth has recently been strong, at about 31% year over year, clearly above the sector median of about 10%. However, the valuation and profitability metrics are much less favorable. The company trades at a price-to-book multiple far above the sector median, while free cash flow is negative and operating profitability remains below typical sector levels.
The balance sheet is one of the cleaner parts of the picture. Debt is almost nonexistent relative to equity, and net debt metrics are negative because cash exceeds borrowings. That gives the company financial flexibility. The problem is that weak cash generation offsets some of that benefit: free cash flow remains negative, and profit margin is deeply negative, showing that accounting losses are still substantial.
Growth
Bitcoin mining sits in a sector that can grow quickly, but not in a smooth or predictable way. Over the long run, demand for digital assets, institutional interest in Bitcoin, and the broader need for high-density power infrastructure can create a favorable backdrop. In that sense, Ionic Digital operates in an area with genuine structural relevance. The more interesting long-term angle is that the company is not just exposed to Bitcoin itself, but also to the strategic value of owning energized sites and operating expertise in power-hungry computing environments.
The strategy makes sense if management can do two things at once: keep mining economics competitive today and broaden the use of its infrastructure over time. That could include improving machine efficiency, increasing uptime, lowering power costs, and potentially using sites for adjacent high-performance computing workloads. Those steps would reduce dependence on pure Bitcoin price movements, which is important because a single-revenue-stream model can produce very volatile results.
Recent public updates have highlighted efforts around scaling operations, improving fleet efficiency, and strengthening the company’s position as an independent digital infrastructure platform after the Celsius-related asset transition. For the market, the most significant opportunity is straightforward: if Bitcoin prices stay elevated while the company maintains or expands productive capacity, revenue can rise quickly because the business has direct exposure to that operating leverage.
Earnings remain negative, which shows that the growth case is still more operational than financial at this stage. The business may be expanding revenue, but that expansion has not yet translated into positive per-share earnings. For a long-term view, this makes execution more important than headline sales growth alone.
Book value per share improved sharply after the restructuring period and stayed positive through 2025, although it pulled back from the 2024 level. That pattern suggests the company did rebuild equity after a distressed phase, but the recent decline also shows that losses can still erode that rebuilt capital base if profitability does not improve.
Risks
This article is for informational purposes only and does not constitute financial advice. Some content is AI-generated. See Disclaimer


