Stock Analysis · Innovex International Inc (INVX)
Overview
Innovex International Inc operates in oilfield equipment and services. The company supplies products used in well construction, completion, and production, with a focus on helping oil and gas operators improve reliability, efficiency, and well performance. In simple terms, it sells specialized hardware and related solutions that are installed in wells and production systems, so its business depends heavily on drilling and completion activity in energy markets.
Innovex today is much larger than it was a few years ago, and that scale-up appears tied to acquisitions and broader product coverage. Revenue rose from about $295 million in 2021 to about $978 million in 2025, which shows a business that has expanded quickly even though quarterly growth has become less consistent more recently.
Based on company disclosures, Innovex generates revenue mainly from consumable and engineered products sold to exploration and production customers, with exposure to both U.S. and international activity. The exact split can vary after acquisitions and reporting changes, but the business can be understood through these main revenue drivers:
- Completion and production-related equipment: estimated to represent the largest share of revenue, likely above 40%. This includes products used after drilling to complete wells and manage flow during production.
- Well construction and drilling-related equipment: estimated to account for roughly 30% to 40%. This includes tools and components used while drilling and preparing wells.
- Other engineered products, service support, and international mix: estimated to make up the remaining 20% to 30%, including accessory products, support activities, and sales tied to overseas markets.
That revenue structure matters because it gives Innovex exposure across multiple phases of the well lifecycle rather than relying on a single product line. It also means results are influenced by customer spending on both new wells and ongoing production work.
The cost structure shows a business with substantial direct manufacturing and sourcing costs, while selling and administrative expenses have also risen as the company expanded. Gross profit increased steadily from 2021 through 2025, but net income was more uneven, suggesting that integration work, taxes, and changing margins still have a meaningful effect on final profitability.
The long-term direction is positive: revenue and gross profit have grown strongly over several years, while operating income improved materially from 2021 levels. At the same time, the jump in 2025 revenue came with less margin expansion than in 2024, which suggests scale alone is not enough and execution remains important.
Key Figures
| Metric | Value | Sector ⓘ |
|---|---|---|
| Date | Oct 17, 2026 | |
| Context | ||
| Sector | Energy | |
| Industry | Oil & Gas Equipment & Services | |
| Market Cap ⓘ | $2.00B | |
| Beta ⓘ | 1.15 | |
Value (Cheapness) | ||
| P/E Ratio ⓘ | 32.25 | 15.44 |
| P/B Ratio ⓘ | 1.83 | 1.73 |
| FCF Yield ⓘ | 6.20% | 8.20% |
| Dividend Yield ⓘ | N/A | 3.59% |
| EBIT / EV ⓘ | 5.42% | 7.46% |
| PEG ⓘ | N/A | |
Growth (Business expansion) | ||
| Revenue Growth ⓘ | 9.20% | 26.90% |
| RPS Growth (5Y CAGR) ⓘ | 13.97% | 6.90% |
| EPS Growth (5Y CAGR) ⓘ | 173.13% | -15.73% |
| BVPS Growth (5Y CAGR) ⓘ | 31.37% | 6.07% |
| Margin Growth (5Y Trend) ⓘ | 8.03% | 0.58% |
| FCF Growth (5Y CAGR) ⓘ | N/A | 1.86% |
| DPS Growth (5Y CAGR) ⓘ | N/A | 16.79% |
Quality (Business durability) | ||
| ROIC (Latest) ⓘ | N/A | 11.40% |
| ROA (Latest) ⓘ | 4.77% | 6.06% |
| ROIC (5Y Median) ⓘ | 21.11% | 10.30% |
| ROA (5Y Median) ⓘ | 16.22% | 5.42% |
| Net Debt / EBIT (Latest) ⓘ | -1.48 | 1.64 |
| Net Debt / EBIT (5Y Median) ⓘ | 0.78 | 1.83 |
| Net Debt / EBITDA (Latest) ⓘ | -0.83 | 1.08 |
| Net Debt / Assets ⓘ | -11.11% | 17.29% |
| EBITDA / Interest ⓘ | 75.02 | 9.64 |
| Operating Margin (Latest) ⓘ | 9.99% | 16.27% |
| Operating Margin (5Y Median) ⓘ | 16.47% | 20.39% |
| Debt to Equity (Latest) ⓘ | 7.04% | 54.76% |
| Profit Margin (Latest) ⓘ | 6.17% | 8.82% |
| Free Cash Flow (Latest) ⓘ | $124.23M | |
Momentum (Price trend) | ||
| 3Y Return ⓘ | +7.28% | +67.38% |
| 12M Return (excl. last month) ⓘ | +74.97% | +49.19% |
| 6M Return ⓘ | +7.48% | +7.07% |
| Price vs. 200-Day MA ⓘ | +3.87% | +9.56% |
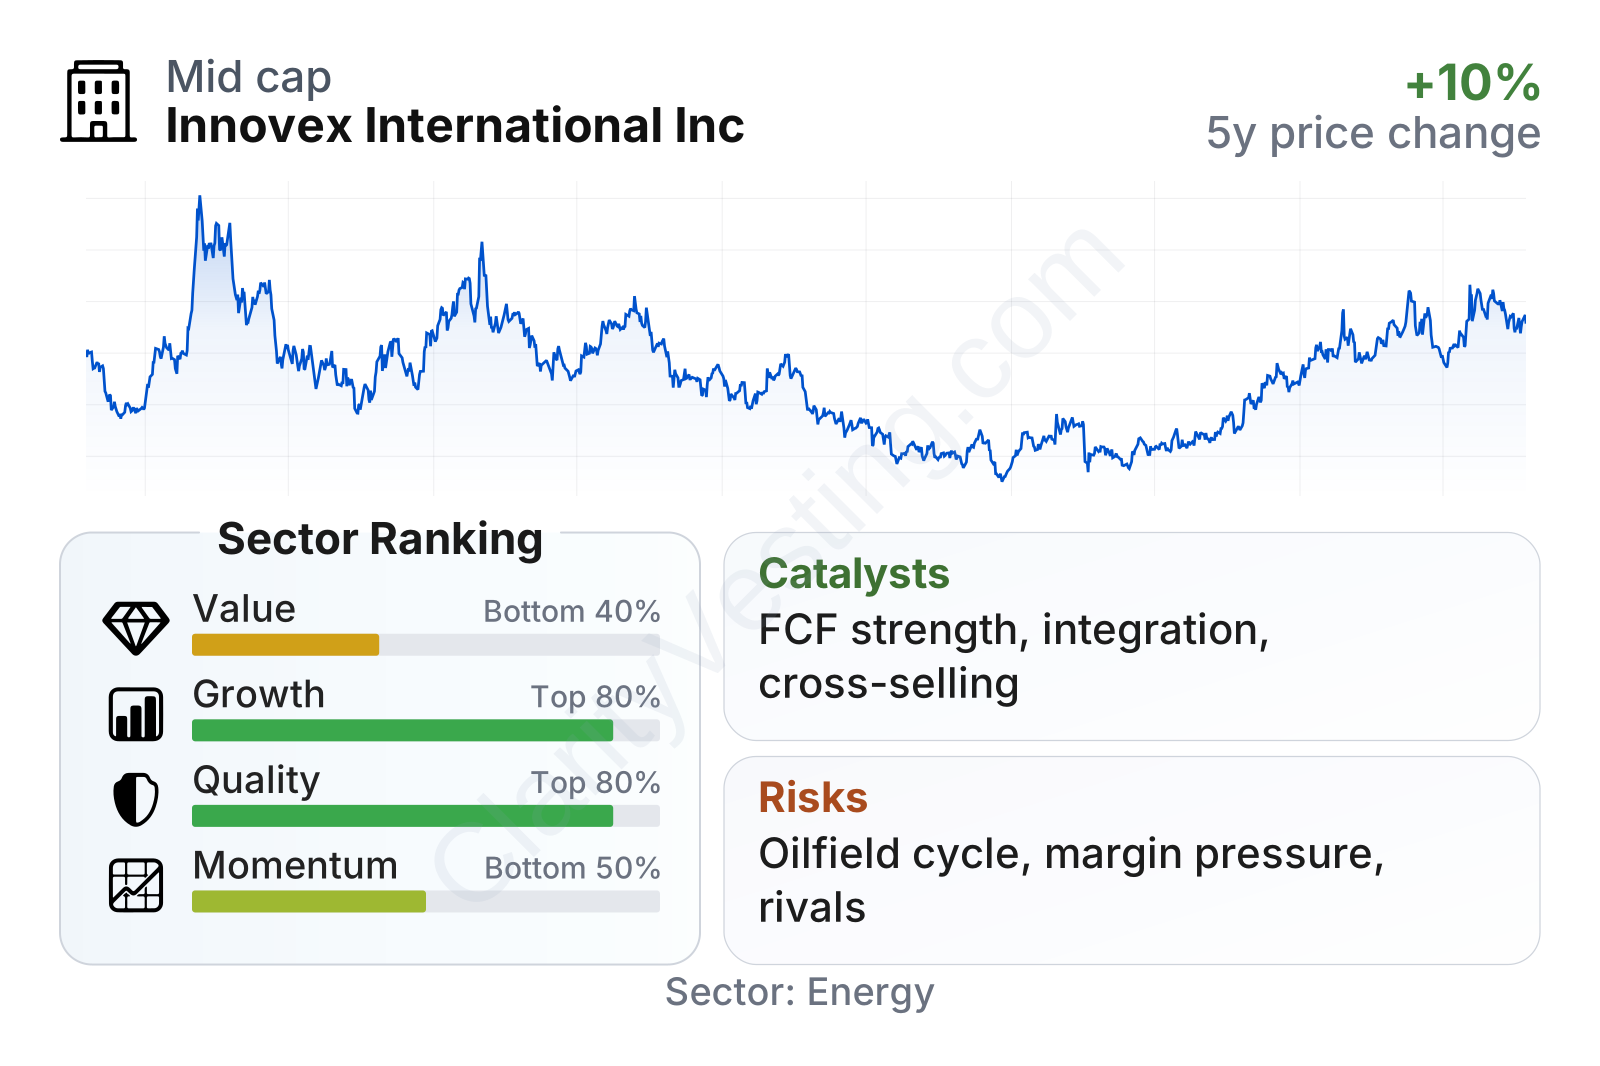
Innovex is a mid-sized energy equipment company with a market value near $2 billion and a share price that has been volatile. After a long weak stretch from 2022 into 2025, the stock rebounded sharply over the last year, which fits with improving business scale and stronger recent market sentiment. In the broader sector comparison, the company ranks well on growth and balance-sheet quality, while valuation looks less attractive and momentum is mixed depending on the time frame. A notable strength is the very low leverage profile, including net cash relative to earnings, while a notable limitation is that current profitability and cash flow yield do not stand out enough to make the shares look obviously inexpensive against peers.
Growth
The company operates in a sector with long-term support from continued global oil and gas production needs, especially in regions where operators are focused on efficiency, replacement demand, and maximizing output from existing assets. Oilfield equipment is not a high-visibility consumer industry, but it remains essential infrastructure for upstream energy activity. That gives Innovex exposure to a market that can grow over time, even if it is cyclical from quarter to quarter.
Innovex’s strategy appears logical for future expansion because it is building scale across multiple product categories rather than depending on one narrow niche. Its five-year record shows strong gains in revenue per share, book value per share, and earnings, and operating margin has improved meaningfully over that period as well. Those are useful signs that the company has not only grown larger, but also converted part of that growth into better economics.
Recent revenue growth has cooled compared with the very strong surges seen in 2024 and 2025. The latest year-over-year pace is around 9%, which is still positive but well below the earlier acquisition-driven jumps. That change does not automatically signal a problem. It may simply mean the company is moving from a rapid expansion phase into a period where it has to prove it can deliver steadier organic growth and integrate what it has already added.
Cash generation is an encouraging part of the picture. Free cash flow moved from negative territory in 2023 to strongly positive levels afterward, and the trailing figure remains solid at well above $100 million. For a company in industrial energy equipment, that matters because free cash flow helps support acquisitions, product investment, debt flexibility, and resilience during slower drilling cycles.
A meaningful catalyst is continued international and product-line expansion following the company’s transformation over the past few years. A larger installed base, broader cross-selling opportunities, and operating leverage could support further earnings growth if management executes well. Another catalyst is the company’s exposure to production-oriented spending, which can be more durable than purely exploration-led demand. If customers keep prioritizing well productivity and efficiency, Innovex has a reasonable setup to benefit.
Risks
This article is for informational purposes only and does not constitute financial advice. Some content is AI-generated. See Disclaimer


