Stock Analysis · International Seaways Inc (INSW)
Overview
International Seaways Inc. is a marine shipping company focused on transporting crude oil and refined petroleum products around the world. In simple terms, it owns and operates large oceangoing tankers that oil producers, traders, and refiners hire to move cargo between exporting and importing regions. The business is tied to global energy trade rather than to oil production itself, so results depend heavily on shipping rates, vessel utilization, trade flows, and fleet management.
The company’s revenue mainly comes from chartering its vessels. Based on the company’s reported operating segments and fleet mix, revenue is primarily generated from crude tankers, with product carriers providing the rest. Exact percentages can shift meaningfully from quarter to quarter because freight rates move a lot, but the broad mix is centered on the following sources:
- VLCC segment: approximately 35% to 45% of revenue in a typical strong market environment. These are very large crude carriers used on long-haul crude routes.
- Suezmax segment: approximately 20% to 30% of revenue. These vessels carry crude oil and are widely used on Atlantic Basin and regional routes.
- Aframax/LR2 segment: approximately 15% to 25% of revenue. These ships can transport crude oil or refined products depending on market conditions.
- MR segment: approximately 10% to 20% of revenue. Medium-range tankers mainly move refined products such as gasoline, diesel, and jet fuel.
- Other revenue: a smaller share tied to lightering, pooling arrangements, and related shipping activities.
This mix matters because crude tanker earnings and product tanker earnings do not always peak at the same time. That gives International Seaways some diversification inside the tanker market, even though it remains clearly exposed to the broader energy shipping cycle.
Over the last several years, the business has moved from losses to very strong profitability as tanker rates improved. Revenue climbed sharply from 2021 through 2023, stayed elevated in 2024, and then eased in 2025 before rebounding again in 2026. That pattern is typical for shipping: earnings can swing hard even when the underlying fleet changes only gradually.
The financial flow over recent years shows a dramatic turnaround. After losses in 2021, the company benefited from a much stronger freight market, with revenue and operating profit expanding quickly in 2022 and 2023. Even after a softer 2025, margins remained unusually high for the sector, which highlights how much operating leverage a tanker owner can have when rates move in its favor.
Key Figures
| Metric | Value | Sector ⓘ |
|---|---|---|
| Date | Oct 17, 2026 | |
| Context | ||
| Sector | Energy | |
| Industry | Oil & Gas Midstream | |
| Market Cap ⓘ | $6.19B | |
| Beta ⓘ | -0.10 | |
Value (Cheapness) | ||
| P/E Ratio ⓘ | 7.99 | 15.44 |
| P/B Ratio ⓘ | 2.61 | 1.73 |
| FCF Yield ⓘ | 4.35% | 8.20% |
| Dividend Yield ⓘ | 0.39% | 3.59% |
| EBIT / EV ⓘ | 22.18% | 7.46% |
| PEG ⓘ | N/A | |
Growth (Business expansion) | ||
| Revenue Growth ⓘ | 140.10% | 26.90% |
| RPS Growth (5Y CAGR) ⓘ | 24.42% | 6.90% |
| EPS Growth (5Y CAGR) ⓘ | 6.82% | -15.73% |
| BVPS Growth (5Y CAGR) ⓘ | 7.55% | 6.07% |
| Margin Growth (5Y Trend) ⓘ | 77.00% | 0.58% |
| FCF Growth (5Y CAGR) ⓘ | N/A | 1.86% |
| DPS Growth (5Y CAGR) ⓘ | 28.60% | 16.79% |
Quality (Business durability) | ||
| ROIC (Latest) ⓘ | 36.78% | 11.40% |
| ROA (Latest) ⓘ | 26.83% | 6.06% |
| ROIC (5Y Median) ⓘ | 18.62% | 10.30% |
| ROA (5Y Median) ⓘ | 15.63% | 5.42% |
| Net Debt / EBIT (Latest) ⓘ | 0.42 | 1.64 |
| Net Debt / EBIT (5Y Median) ⓘ | 1.25 | 1.83 |
| Net Debt / EBITDA (Latest) ⓘ | 0.37 | 1.08 |
| Net Debt / Assets ⓘ | 16.34% | 17.29% |
| EBITDA / Interest ⓘ | 3.38 | 9.64 |
| Operating Margin (Latest) ⓘ | 93.21% | 16.27% |
| Operating Margin (5Y Median) ⓘ | 48.90% | 20.39% |
| Debt to Equity (Latest) ⓘ | 28.82% | 54.76% |
| Profit Margin (Latest) ⓘ | 61.77% | 8.82% |
| Free Cash Flow (Latest) ⓘ | $269.32M | |
Momentum (Price trend) | ||
| 3Y Return ⓘ | +269.48% | +67.38% |
| 12M Return (excl. last month) ⓘ | +161.93% | +49.19% |
| 6M Return ⓘ | +82.15% | +7.07% |
| Price vs. 200-Day MA ⓘ | +55.51% | +9.56% |
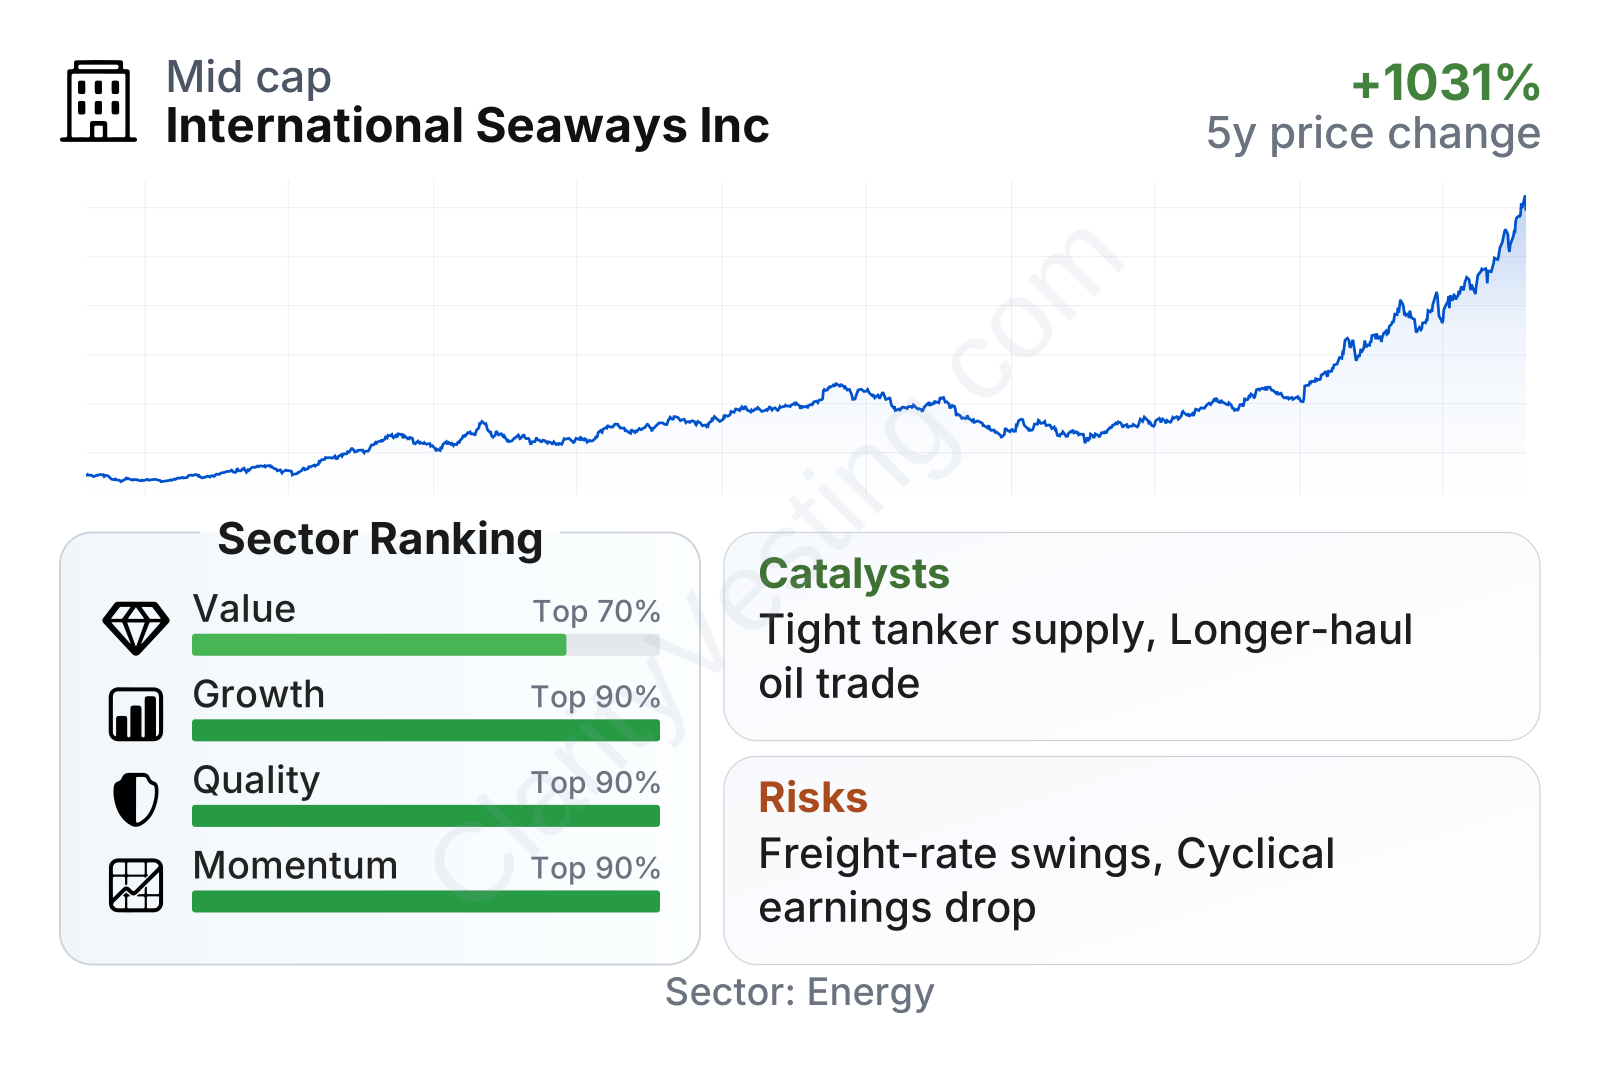
International Seaways screens as a large listed tanker owner with unusually strong growth, profitability, and market momentum relative to most energy peers. The table suggests a mixed valuation picture on the surface: the earnings multiple is low, but book value is less conservative than many sector names. Quality stands out the most, with very high returns on capital and low leverage compared with the sector. Growth metrics are also far above median levels, which reflects both cyclical recovery and effective fleet deployment.
The stock chart also shows how cyclical re-rating works in shipping. After trading at much lower levels in 2021 and early 2022, the shares rose sharply as tanker markets tightened and earnings accelerated. That kind of move can create strong long-term gains, but it also reminds readers that shipping equities can be more volatile than ordinary industrial businesses.
Growth
International Seaways operates in a sector that is not a classic secular growth industry like software or healthcare, but it can still create strong results when supply and demand become favorable. Tanker shipping benefits when oil and refined product trade volumes expand, when voyages become longer, and when the global fleet grows slowly. Those conditions have been supported in recent years by sanctions-related trade reshuffling, a shift toward longer-haul exports from the Americas and Middle East, and disciplined new vessel ordering across parts of the tanker market.
The company’s strategy makes sense for this type of industry. Instead of trying to grow at any cost, it has focused on fleet quality, commercial flexibility, and balance-sheet discipline. In shipping, avoiding overexpansion near the top of a cycle can be just as important as adding capacity. International Seaways has also maintained exposure across several tanker classes, which helps it capture opportunities in crude and product markets rather than relying on a single niche.
Revenue growth has been highly cyclical, which is normal for tanker shipping, but the recent rebound is notable. After slowing and contracting through much of 2024 and part of 2025, growth turned positive again and then accelerated sharply in 2026. That suggests a meaningful recovery in market conditions rather than a simple one-quarter fluctuation.
Cash generation tells a similar story. Free cash flow moved from negative levels during the weaker period to very strong positive levels during the market upswing, then moderated as rates cooled. Even with that moderation, the company has remained cash generative, which gives it flexibility for debt reduction, dividends, vessel upgrades, and opportunistic capital allocation.
A key catalyst for future growth is limited fleet supply. Building new tankers takes time, shipyard capacity is constrained, and owners have been relatively cautious with ordering because of uncertainty around future propulsion technology and environmental rules. If oil trade remains resilient while vessel supply stays tight, established operators with available tonnage can continue to benefit. Another meaningful catalyst is route dislocation: when cargoes travel longer distances because of sanctions, regional imbalances, or changes in refining capacity, tanker demand can rise even if total oil consumption does not surge.
Recent company updates have also pointed to continued fleet activity, charter coverage, and shareholder returns, all of which indicate management is trying to balance near-term cash extraction with longer-term flexibility. In this industry, preserving optionality during strong markets is often a sign of sensible positioning.
Risks
This article is for informational purposes only and does not constitute financial advice. Some content is AI-generated. See Disclaimer


