Stock Analysis · Insmed Inc (INSM)
Overview
Insmed Inc. is a biotechnology company focused on serious and rare diseases, especially in pulmonary and inflammatory conditions. Its business today is built around one marketed medicine and a pipeline of newer programs that could expand the company far beyond its current base. The approved product is ARIKAYCE, an inhaled antibiotic used for certain adults with refractory nontuberculous mycobacterial lung disease caused by Mycobacterium avium complex. In simple terms, Insmed is trying to serve patients with difficult lung diseases where treatment options have historically been limited.
Revenue is still highly concentrated. Based on recent company reporting, the company’s sales mix is dominated by ARIKAYCE, while the rest comes mainly from collaboration and other revenue items that can vary from period to period.
- ARIKAYCE product revenue: about 95% to 100% of total revenue in recent periods. This includes commercial sales in the United States and international markets.
- Collaboration, license, and other revenue: about 0% to 5%. This can include milestone-related or partner-related items and is not the core recurring revenue engine at this stage.
That concentration matters. It means Insmed already has a real commercial product, which is a strength compared with many development-stage biotechnology companies, but it also means the business still depends heavily on one medicine while newer programs are being developed.
The broader financial picture shows a company with rising revenue, but one that is still spending much more on research, development, and commercialization than it brings in. Gross profit has expanded with sales, yet operating losses have widened because research and selling expenses have increased even faster as Insmed pushes multiple programs forward.
The revenue base has improved steadily over the last several years, but the cost structure makes clear that this is still a scale-building biotechnology company rather than a mature, cash-generating pharmaceutical business.
Key Figures
| Metric | Value | Sector ⓘ |
|---|---|---|
| Date | Oct 24, 2026 | |
| Context | ||
| Sector | Healthcare | |
| Industry | Biotechnology | |
| Market Cap ⓘ | $20.54B | |
| Beta ⓘ | 0.82 | |
Value (Cheapness) | ||
| P/E Ratio ⓘ | N/A | 25.42 |
| P/B Ratio ⓘ | 27.28 | 3.08 |
| FCF Yield ⓘ | -4.08% | 3.12% |
| Dividend Yield ⓘ | N/A | 1.85% |
| EBIT / EV ⓘ | -3.06% | 0.56% |
| PEG ⓘ | 1.09 | |
Growth (Business expansion) | ||
| Revenue Growth ⓘ | 296.10% | 7.50% |
| RPS Growth (5Y CAGR) ⓘ | 13.99% | 8.60% |
| EPS Growth (5Y CAGR) ⓘ | -25.71% | -17.73% |
| BVPS Growth (5Y CAGR) ⓘ | -1.41% | 3.72% |
| Margin Growth (5Y Trend) ⓘ | N/A | -0.57% |
| FCF Growth (5Y CAGR) ⓘ | N/A | 0.96% |
| DPS Growth (5Y CAGR) ⓘ | N/A | 6.69% |
Quality (Business durability) | ||
| ROIC (Latest) ⓘ | -46.42% | 3.17% |
| ROA (Latest) ⓘ | -39.22% | 2.98% |
| ROIC (5Y Median) ⓘ | -51.38% | 4.56% |
| ROA (5Y Median) ⓘ | -50.20% | 1.87% |
| Net Debt / EBIT (Latest) ⓘ | N/A | 1.34 |
| Net Debt / EBIT (5Y Median) ⓘ | N/A | 1.86 |
| Net Debt / EBITDA (Latest) ⓘ | N/A | 1.00 |
| Net Debt / Assets ⓘ | 1.67% | 5.06% |
| EBITDA / Interest ⓘ | N/A | 9.55 |
| Operating Margin (Latest) ⓘ | -69.49% | 9.25% |
| Operating Margin (5Y Median) ⓘ | -211.09% | 7.33% |
| Debt to Equity (Latest) ⓘ | 76.55% | 26.68% |
| Profit Margin (Latest) ⓘ | -76.94% | 3.34% |
| Free Cash Flow (Latest) ⓘ | -$837.67M | |
Momentum (Price trend) | ||
| 3Y Return ⓘ | +281.77% | +51.61% |
| 12M Return (excl. last month) ⓘ | -16.69% | +19.90% |
| 6M Return ⓘ | -34.21% | +10.10% |
| Price vs. 200-Day MA ⓘ | -25.44% | +6.44% |
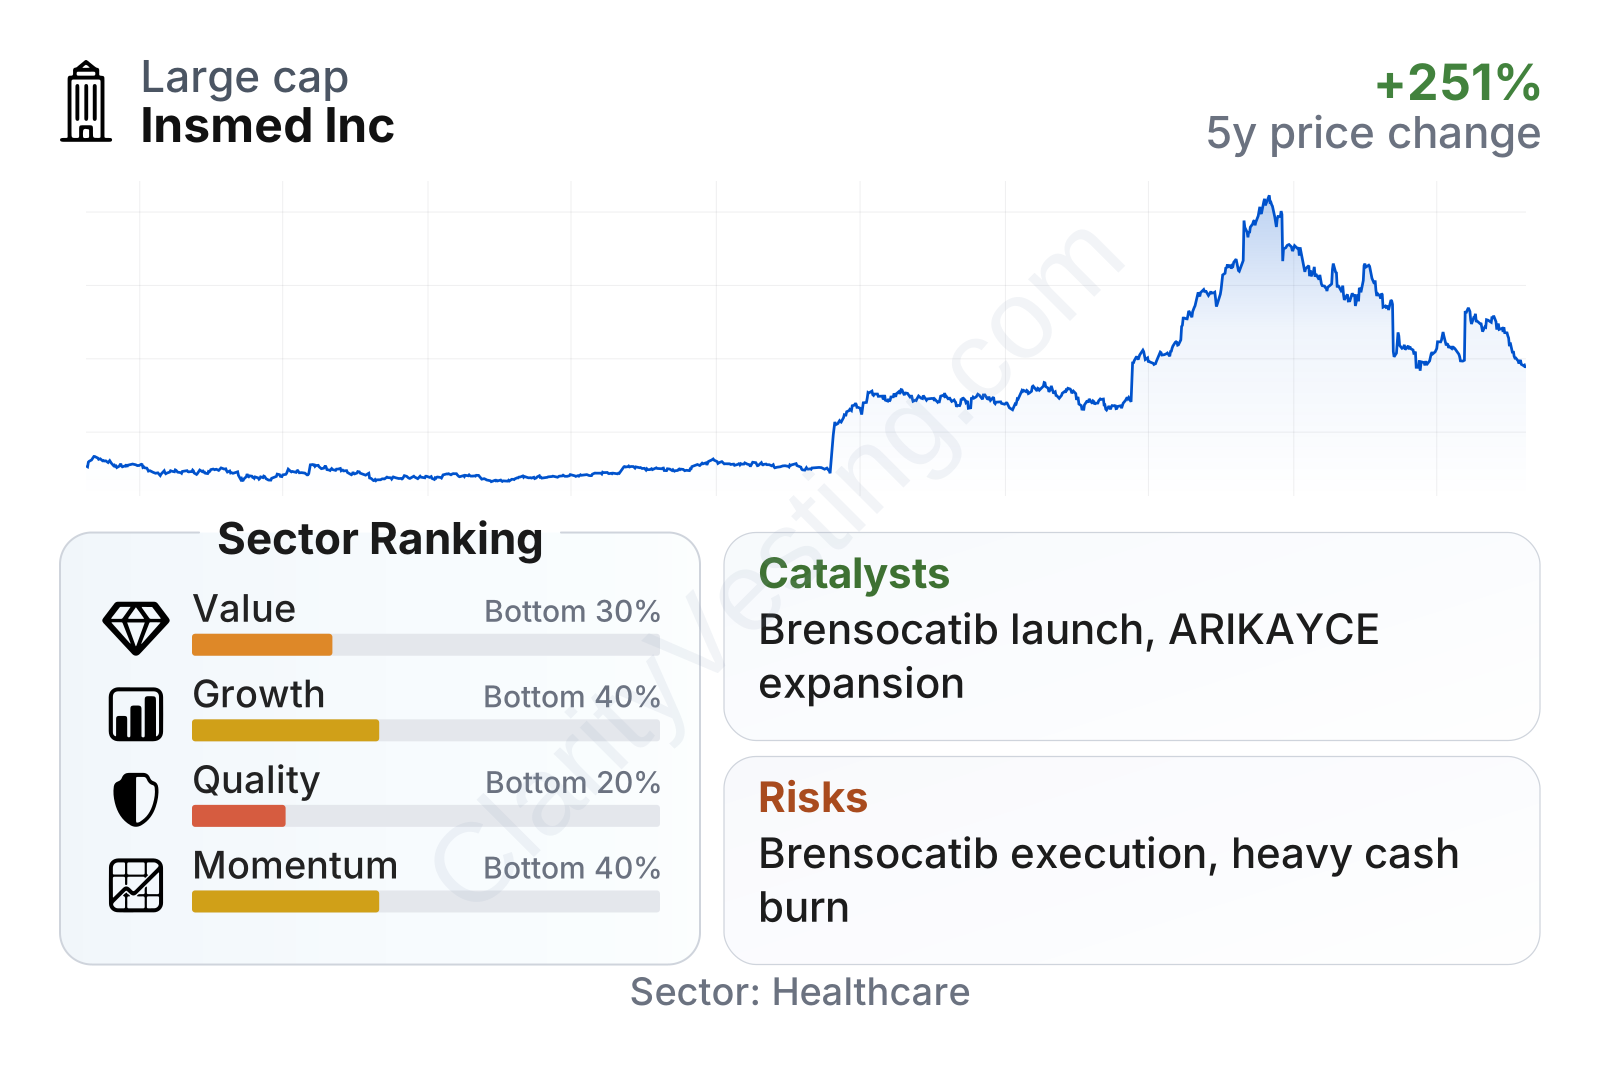
Insmed has grown into a large biotechnology company by market value, but its operating profile still looks like a business in heavy investment mode. The table points to weak value, quality, and profitability metrics relative to much of the healthcare sector, which is expected for a company with strong pipeline spending and ongoing losses. Growth has been powerful on revenue, while share-price momentum has cooled after a major multiyear run-up.
The stock’s longer-term chart reflects a sharp re-rating as expectations around the pipeline improved, especially from 2024 into early 2026. More recently, the pullback suggests the market is reassessing how much future success is already reflected in the valuation.
Growth
Insmed operates in an attractive part of healthcare. Rare-disease and specialty biotech markets tend to offer strong pricing power, high medical need, and potentially long product life cycles when therapies prove meaningfully differentiated. Pulmonary diseases are also a significant area of unmet need, especially when they are chronic, progressive, and poorly served by standard treatments.
The company’s strategy is straightforward and sensible: keep expanding ARIKAYCE, while using that commercial foundation to advance higher-value pipeline programs. The biggest growth driver is no longer just ARIKAYCE itself. The market has become much more focused on brensocatib, an oral DPP1 inhibitor being developed for bronchiectasis and other neutrophil-driven inflammatory diseases. If successfully launched, it could move Insmed from a one-product rare-lung company toward a broader specialty biopharma platform.
Revenue growth has accelerated dramatically, far above the sector median. That surge shows both commercial progress and the market’s expectation that Insmed is entering a new phase. Even so, it is important to separate current sales from future hopes: most of today’s revenue still comes from ARIKAYCE, while much of the market excitement is tied to assets that are not yet contributing product sales at scale.
Recent company updates have reinforced the growth case. Public disclosures in 2026 highlighted continued preparation for the potential commercialization of brensocatib following positive late-stage development progress, while Insmed has also continued advancing inhaled and gene-based programs in pulmonary arterial hypertension and related diseases. These are meaningful opportunities because they target severe conditions with limited treatment options and potentially large specialty markets.
The main tradeoff is visible in cash flow. Free cash flow remains deeply negative and has become more negative over time, which is typical for a biotech company scaling late-stage studies and launch infrastructure. In practical terms, growth is real, but it is being purchased with heavy upfront spending.
Risks
This article is for informational purposes only and does not constitute financial advice. Some content is AI-generated. See Disclaimer


